U.S. EQUITY ETFS REBOUND AS SMALL CAPS TAKE THE SPOTLIGHT
U.S. Distribution pulse quarterly | 1Q 2024
The U.S. Distribution Pulse Quarterly webcast offers additional commentary. For the Q1 2024 U.S. Distribution Pulse Quarterly on-demand webcast, click here.
A surprising first half of the year led to significant ETF growth in the second half of 2023
Exchange-traded funds (ETFs) experienced rare quarterly outflows in Q1 2023, for the first time since the start of the 2020 pandemic. Market concerns, rising interest rates, the yearly aftermath of Q4 tax-loss harvesting, and competition from money market funds all contributed to this unusual quarter.
In addition, U.S. equities absorbed most of the outflows. As fixed income dominated flows in the first half of the year, the only bright spots for equities occurred in U.S. active equity ETFs and direct index separately managed accounts (SMAs).
Rebound in H2 2023
These trends began to shift in the second half of 2023 with U.S. equity ETFs seeing a significant sales surge. In fact, Q4 2023 saw the highest U.S. equity flows since the end of 2021.
Market momentum in large caps helped U.S. Large Cap lead the pack. Sales lifted for the largest products tracking the S&P 500 (such as Vanguard S&P 500 VOO, SPDR S&P 500 SPY) and Nasdaq 100 (such as Invesco QQQ).
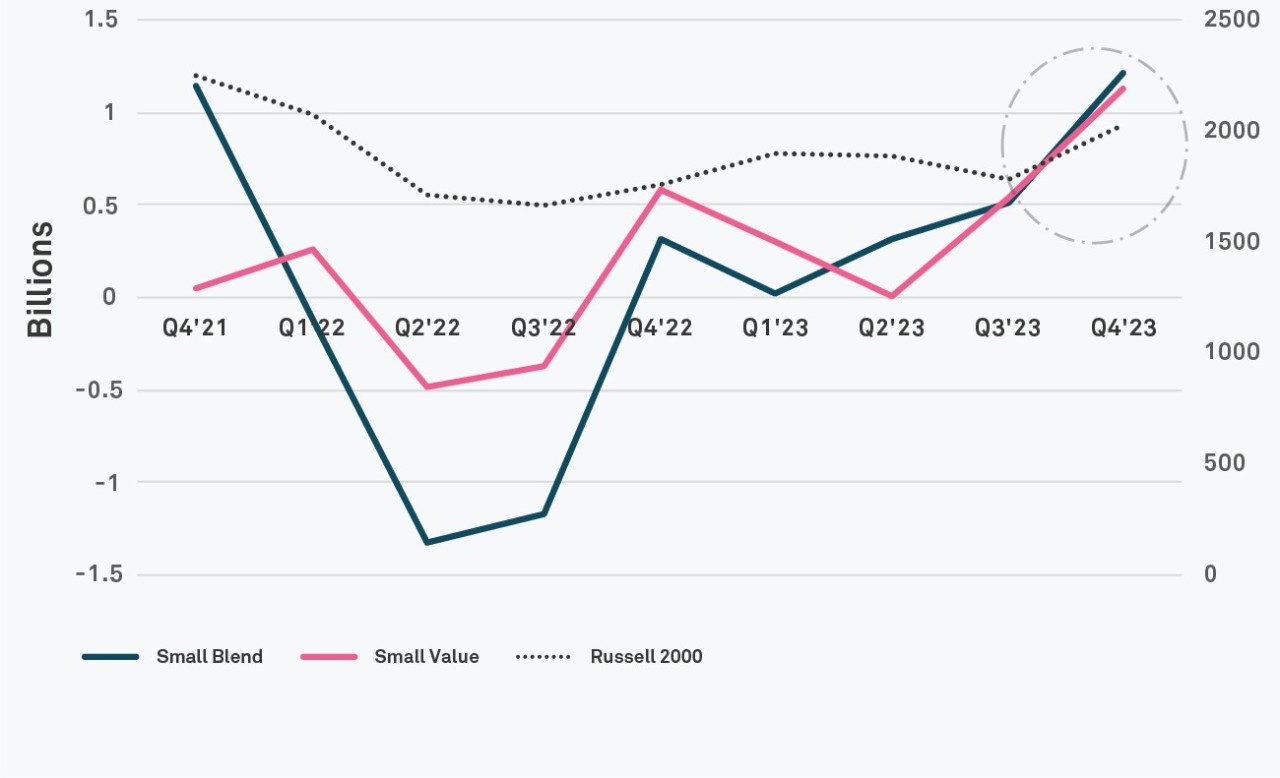
However, Large Cap was not the only strategy to see inflows as 2023 progressed. U.S. All Cap made the largest year-over-year jump in net sales, by a wide margin. Small Cap Blend and Value saw mostly outflows in 2022 but, in the second half of 2023, they began recording inflows. This reversal makes sense given the performance of the Russell 2000, which rallied by 24.28% as of year-end from its market bottom on October 27, 2023.
Figure 1: Wirehouse Net Sales - Fee-Based Programs

Source: BNY Mellon Growth Dynamics. Trend data as of December 31, 2023.
A Shift in the balance
Have ETF flows pivoted away from the S&P 500 to diversify portfolio allocations?
Investor concerns continue to rise around the dominance of “The Magnificent Seven” stocks (Apple (AAPL), Microsoft (MSFT), Amazon (AMZN), Nvidia (NVDA), Meta Platforms (META), Tesla (TSLA), and Alphabet (GOOG/GOOGL) in the S&P 500 Index. Flows in the second half of 2023 began to echo those concerns.
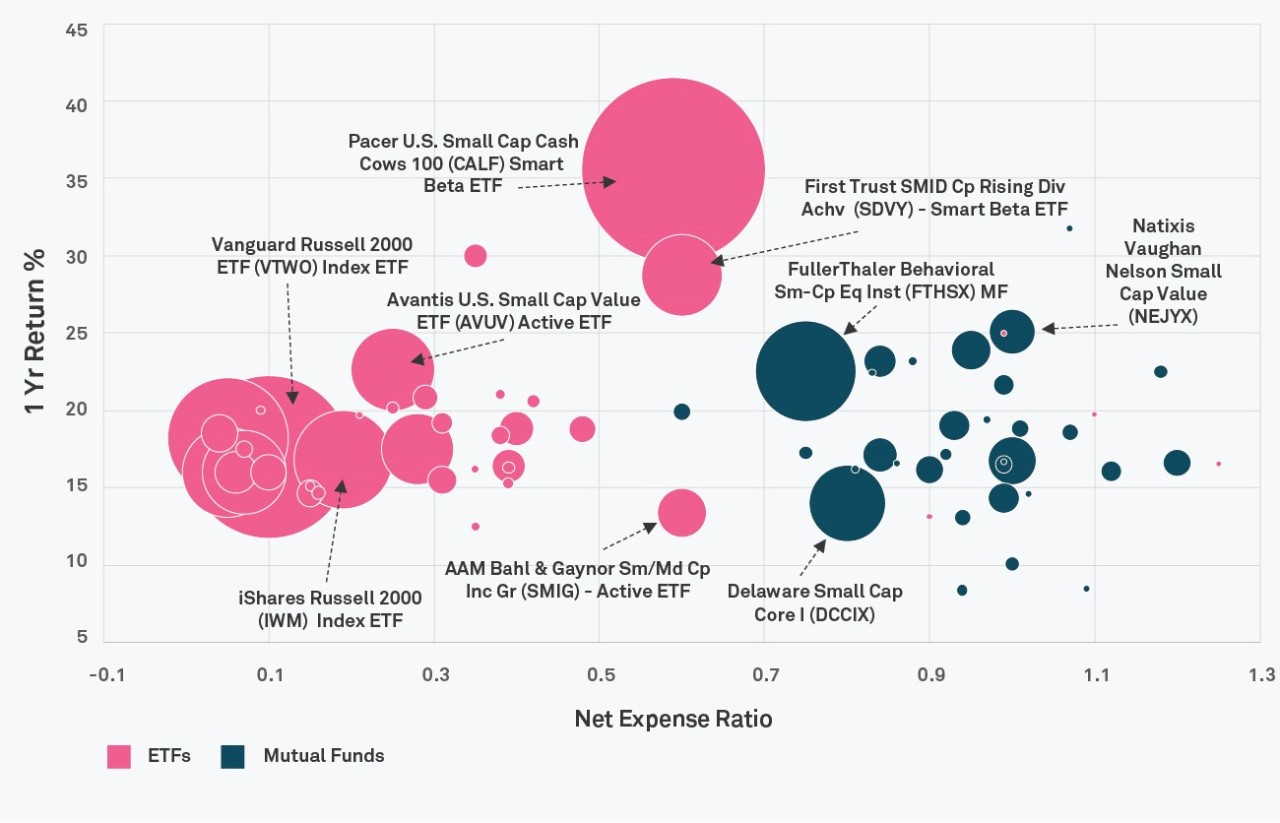
ETFs such as Vanguard Russell 2000 (VTWO), iShares Russell 2000 IWM and non-market cap weighted small cap, such as Pacer U.S. Small Cap Cash Cows (CALF), drove sales inside both home office model programs and Rep as Portfolio Manager programs.
Figure 2: Wirehouse Channel: $3.9B in Small Cap and Blend ETF and Mutual Fund Net Sales (FY 2023)

Source: BNY Mellon Growth Dynamics. Trend data as of December 31, 2023.
As a result, flows into small caps and flows away from large caps are a key trend to watch as 2024 progresses.
Please reach out to the Growth Dynamics team who can help you use this market data to uncover opportunities and achieve deeper engagement with financial advisors.
All flow data is sourced from BNY Mellon Growth Dynamics as of December 31, 2023. The aggregate data used in this analysis is based on Mutual Fund, ETF and SMA asset and sales data reported to BNY Mellon Growth Dynamics under a data sponsor agreement. Data currently represents approximately $3.1 trillion in assets under management (AUM) with national broker-dealers. The data set includes sales through a financial advisor and excludes institutional and retirement plan sales.
Disclaimer
BNY Mellon is the corporate brand of The Bank of New York Mellon Corporation and may be used to reference the corporation as a whole and/or its various subsidiaries generally. This material does not constitute a recommendation by BNY Mellon of any kind. The information herein is not intended to provide tax, legal, investment, accounting, financial or other professional advice on any matter, and should not be used or relied upon as such. The views expressed within this material are those of the contributors and not necessarily those of BNY Mellon. BNY Mellon has not independently verified the information contained in this material and makes no representation as to the accuracy, completeness, timeliness, merchantability or fitness for a specific purpose of the information provided in this material. BNY Mellon assumes no direct or consequential liability for any errors in or reliance upon this material.
BNY Mellon will not be responsible for updating any information contained within this material and opinions and information contained herein are subject to change without notice.
BNY Mellon assumes no direct or consequential liability for any errors in or reliance upon this material. This material may not be reproduced or disseminated in any form without the prior written permission of BNY Mellon. Trademarks, logos and other intellectual property marks belong to their respective owners.
© 2024 The Bank of New York Mellon Corporation. All rights reserved.


