


THE ALTA REPORT.
A quarterly compilation derived from our unique vantage point at the intersection of markets. Touching approximately 20% of the world’s investable assets gives us insight into key trends, helping you navigate the future arc of markets and macro developments.
Tailwinds for 2024?
The worst of the inflation battle may be behind us, with central banks in all developed economies except Japan looking set to pivot to rate cuts this year. Investors appear to be pulling cash off the sidelines and extending duration in bonds while being short the U.S. dollar.
Our economists agree with markets that U.S. rate cuts will come this year, but they are unlikely to be as deep as what is priced in. Investors should note the potential for further rate volatility ahead and the risk of rising yields if those cuts do not materialize. And even if the U.S. achieves a soft landing, there could still be some potential for a global recession.
Europe already seems to be heading into recession, and the U.K. continues to battle stubborn inflation. It is unclear how quickly their central banks will cut rates, but the European Central Bank is likely to go first. Meanwhile, China is looking to fiscal stimulus to boost its economy in 2024, but is still dealing with a property hangover.
Our iFlow strategists have favored U.S. equities over other developed markets but with valuations high, 2023-like returns may be out of reach. Overall, the backdrop seems to augur well for high-quality fixed income, given slowing economic activity, and investors have already been extending duration ahead of anticipated rate cuts.
Geopolitical headwinds, worsening government deficits and a number of important elections may prove additional catalysts for volatility this year. Some four billion people, roughly half of the world, will head to the polls, with elections coming in the U.S., the U.K., the EU, India, Indonesia and Taiwan, among other places.
Global Macro
Hoping for a U.S. Soft Landing
The U.S. remains the macro bright spot, with market consensus calling for a soft landing and below-trend growth. One of our senior economists, Shamik Dhar, believes there is a 40% probability of a U.S. recession in 2024, which is lower than consensus.
As for the pivot toward rate cuts, it now appears to be a question of when, not if. Investors increased the duration of their U.S. fixed-income holdings in the fourth quarter, anticipating that rates had peaked. However, the market seems to be getting ahead of itself on both the timing and extent of those potential cuts; aggressive easing is unlikely in the absence of macroeconomic distress. In the view of Vincent Reinhart, another one of our senior economists, the first rate cut may be slightly later than the market expectation of this spring, possibly as late as the fall.
Meanwhile, our macro strategist John Velis believes the Federal Reserve could shave 100 basis points off the federal funds rate this year, reaching a range of 4.25%-4.5% by year end, and that the 10-year Treasury yield will likely rise to 5%, if not higher, in 2024 due to concerns over the additional supply of Treasury issuance.
Easy Landing
The market may be getting ahead of itself on the timing and extent of rate cuts.

Dollar May Have Peaked
Cooling inflation and rising expectations for Fed rate cuts spurred a wave of U.S. dollar (USD) selling in the fourth quarter. The yen (JPY) rallied against the dollar, and our head macro strategist, Bob Savage, believes that it could strengthen, possibly pushing USD/JPY down to 100 by year-end.
He also believes dollar weakening is not likely to be significant, even after the Fed cuts rates. It is also possible that the dollar could strengthen temporarily in the first quarter, given the strength of the U.S. economy relative to Europe and the U.K.
Worsening geopolitics or any sharp slowing of the U.S. economy that hurts global growth could quickly bring back demand for the dollar. Counteracting this is the potential for investor outflows from dollar-denominated assets if confidence sours further in Congress’s ability to lower government deficits.
Passing the Buck
Trade-weighted dollar holdings have fallen.


The yen could strengthen, possibly pushing USD/JPY down to 100 by year-end.
Bullish on Yen

Our institutional clients have taken out a moderately long position in the Japanese yen over the last few months. This comes amid expectations that the Bank of Japan (BoJ) will introduce policy shifts in 2024 by raising domestic interest rates.
In 2023, the BoJ signaled policy loosening by recharacterizing its previous 1% cap on 10-year Japanese government bond yields as just a reference point. Our strategist Bob Savage sees the BoJ ending the policy completely in early 2024, and also exiting negative interest rates by raising them 10 basis points to 0% and then increasing rates to 0.4% before the end of 2024.
Most of the clients we price options trades for are positioned for dollar/yen to fall below 140 before year end. If USD/JPY were to fall meaningfully by year end, they could potentially sell or exercise their options profitably, and buy back dollars at a reduced cost.
Going to Japan
Overseas investors were buying into the Japanese yen in 2023.

ECB to Cut Before BoE
ECB officials said recently that recession is likely, and our corporate bond flows in Europe already reflect souring investor sentiment toward certain eurozone economies. Our iFlow team believes weak manufacturing will spur the ECB to cut rates in April, possibly before the Bank of England (BoE) and Fed do. If that happens, the euro would likely depreciate against the U.S. dollar, the Australian dollar and the pound, among other currencies.
Germany looks especially weak, with higher energy prices driven by Russia’s invasion of Ukraine and low expectations for its automotive sector. German corporate bond flows plummeted in late September, our iFlow data show, but despite this, they are still performing better than Italy’s.
The U.K., as a services-based economy, is treading water but is still experiencing higher inflation than many of its regional peers, with our senior economist Shamik Dhar seeing rate cuts in the U.K. after this spring. Meanwhile, our iFlow data shows clients started increasing their U.K. gilt holdings last spring and are still maintaining most of those positions.
Recession Risk
Our clients are selling German and Italian corporate bonds.


Weak manufacturing may spur the ECB to cut rates in April, possibly before the Bank of England.
Too Bearish Over China
A modest recovery in China is possible in 2024. Although the yuan was underheld by our overseas institutional investor clients last year, iFlow data shows that in December, Chinese sovereign bonds had their two best weeks of inflows since August 2021.
For now, however, foreign net flows into China equities are essentially flat, and cumulative China-based bond and equity holdings (onshore and offshore) are now back at 2020 levels. Our macro strategist Geoff Yu believes that markets are possibly too bearish at current levels, even with household demand subdued and property-sector issues to work through. These and other factors were likely behind the substantial outflows in 2023 from Chinese corporate bonds (roughly 20% are in real estate), but he believes Beijing is unlikely to allow systemic risks to grow in its real estate market.
Yu sees China’s growth rate rising to 5% and the yuan not facing material depreciation pressure in the current cycle. He also expects the economy to escape deflation, but other traditional growth areas for the global economy, such as outbound tourism and commodity demand, to remain weak. The Chinese government was late in expanding its budget deficit last year, so this could stimulate equities but will likely weigh on the bond market and the yuan near term.
Got Mojo
Foreign investors are finally tiptoeing back into Chinese sovereign bonds.

Fixed Income
MMFs Lengthen Holdings
Institutional Government and Treasury money-market funds (MMFs), which represent the largest segment of the roughly $6 trillion in assets invested in the space, significantly extended their weighted average maturities (WAMs) in the fourth quarter to protect their yields and remain highly competitive versus other liquidity instruments if the Fed begins to cut interest rates.
Government money-market fund data from our Dreyfus platform show those funds’ median WAMs had increased to 36 days at the end of November, up from 27 days at the end of the third quarter, amid growing consensus that the Fed had finished rate hikes. (Typically, these funds’ WAMs only move one to two days a month.) Across the industry, for funds that allow repo, Treasury and agency securities holdings exceeding 90 days in duration rose to 13% from 9% from September to October, also signaling their comfort that rates have peaked.
When the Fed begins cutting interest rates, certain liquidity investors may rotate back into MMFs, given that Treasury bills and repos should immediately reflect the expectation of lower rates or reset lower.
Long Shot
Even money market funds (MMFs) are extending duration in their portfolios.

Cash Set to Underperform
With the Fed likely at peak rates, many ultra-high-net-worth clients are already reducing excess cash in their portfolios and adding duration in bonds. This has the potential to not only lock in high income for a number of years, but also benefit from a rally that typically takes place in bond prices at the end of rate-hiking cycles.
The average percentage of wealth accounts holding more than 5% in cash within our Wealth Management business has halved in the past year, reaching its lowest levels since 2021.
Historically, when Fed rates peaked, investors have on average earned more attractive returns in short- and intermediate-term municipal bonds on an after-tax basis than in Treasury bills, assuming a 40% federal tax rate and using the last three tightening cycles as a general guide.

The average percentage of wealth accounts holding more than 5% in cash within our Wealth Management business has halved.
CDs Get a Jolt
Certificates of deposit (CDs) grew in popularity among our retail and institutional clients in 2023, our Pershing execution and clearance data show, especially now that banks are generally willing to pay significantly more yield to attract stickier deposits. Pershing’s sales of 0-1 year CDs during 2023 were almost double the comparable period in 2021, our clearance data show.
Banks began offering higher CD rates as a way to draw in stable deposit flows after the collapse of Silicon Valley Bank in March. In October, the average annual percentage yield (APY) on a one-year CD on our Pershing clearance platform was 5.5%, up from just 0.13% in January 2022, increasing CDs’ attractiveness relative to Treasury bill yields.
CD Comeback
Purchases of certificates of deposit have risen as banks offer better yields.

Pershing’s sales of 0-1 year CDs during 2023 were almost double the comparable period in 2021.
Dipping Back Into Duration
Real-money investors, institutions that tend to invest for the long haul, ended up being steady buyers of Treasurys in 2023. Through iFlow, we observed them buying longer-duration Treasurys when 10-year yields hit 4.5% in August, seemingly eager to catch the rally in bonds that tends to follow peak rates. They then mostly exited those positions in September, only to return when yields hit a 5% intraday high, and they were able to ride the rally that followed. More recently, however, real money has been buying all across the curve.
U.S. corporate pension plans we service above $1 billion in assets have added duration as well, increasing their U.S. longer-end fixed-income holdings by 19% in September and another 10% in October alone, while reducing short-end U.S. fixed income assets by 2.58% and 0.72% in September and October, respectively.
Duration Dominates
U.S. Treasury flows show investors are extending duration.


Retail Financial Advisors Extend Duration
Retail advisors moved early to extend the duration of their clients’ portfolios, investing in long-duration ETFs even when they had realized negative returns through most of 2023. Our retail broker-dealer data from four major U.S. wirehouses show financial advisors favored vehicles like the iShares 20+ Year Treasury Bond ETF "TLT" and the Vanguard Long-Term Treasury ETF "VGLT," specifically.
Short- and ultrashort-duration fixed income saw significant outflows in the third quarter, with eight out of the top 10 fixed income outflows in our data coming from ETFs bearing that focus. Meanwhile, the longest-duration government ETFs captured 35% of net inflows.
Longer-duration investments may suggest a focus on capital appreciation and a desire to lock in higher yields, versus taking on the reinvestment risk in the short-term portion of the curve.
Going Long
Wirehouse inflows into taxable fixed income ETFs* are shifting towards longer.

Short- and ultra-short duration fixed income saw significant outflows in the third quarter.
Mortgage Bond Liquidity Falls to 3yr Lows
A new liquidity score developed by our Buy-Side Trading Solutions team shows that liquidity in agency mortgage-backed securities (MBS) was back to its lowest point in more than three years.* Excluding the Covid period, it was at five-year lows.
The liquidity score factors in such metrics as the percentage of brokers offering the best quotes, the difference between the best and worst quotes and the time it takes for brokers to price trades.
These results matched what our traders have seen in the market, as older MBS pools with 2% to 3% coupons have languished now that newer mortgage pools offer 6%-7% coupons. The time it takes for brokers to come back with a price is at a one-year low, according to our analysis, and the aggressiveness of broker bids is close to five-year lows. The spread between best and worst pricing has also widened, and the frequency of missing quotes is close to the lows for the year in 2023.
*BTS data we analyzed ranged from 2019-2023.
Languishing Liquidity
Our measure of mortgage-backed securities liquidity has fallen to a three-year low.

The time it takes for brokers to come back with a price is at a one-year low.
Equities
Large Cap ETFs/SMAs Excel
U.S. retail broker dealers overwhelmingly favored equity ETFs and Separately Managed Accounts (SMAs) over mutual funds in the third quarter, and within ETFs, the large-cap equities blend was the most popular investment style. Large-cap blend investment products captured three of the top 10 wirehouse rankings by investment style for the third quarter, and three large blend styles —index ETFs (42%), smart beta ETFs (26%) and large blend Direct Index SMAs (25%)— made up 94% of large blend net sales in the third quarter.
Overall, U.S. equity mutual funds represented 68% of all outflows in the quarter, as flows into U.S. equity ETFs and SMAs accounted for 24% and 15% of inflows, respectively. The big attraction of ETFs continued to be their flexibility and having lower fees than mutual funds, while the growing interest in tax-efficient Direct Index styles drove 75% of U.S. equity SMA flows. Wirehouse take-up of SMAs in the quarter reached their highest levels since the first quarter of 2022.
Core Competency
Large-cap blends and intermediate government fixed income lead the top-ranked strategies.

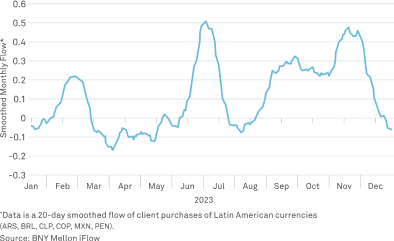
LatAm EMs Lose Shine
Our data show that institutional clients, who have been very overweight Latin American equities and currencies in 2023, are starting to de-risk by reducing some of those exposures and adding to their hedges. The reasoning appears to be the rate cuts that have swept the region (except Mexico) as well as the deteriorating commodity outlook with copper, lithium and soy prices collapsing.
However, iFlow saw a rising interest in local bonds in the third quarter (Colombia, Chile, Brazil and Mexico sovereign bonds) on account of low local inflation and higher rates relative to developed markets. For much of the second half of 2023, LatAm currencies (especially the Mexican peso (MXN) and Colombian peso (COP)) have also been popular among so-called carry traders who borrow in low-yielding currencies like the Swiss franc and invest in higher-yielding ones. More recently, high-yielding central and eastern European currencies such as the Hungarian forint (HUF) also benefitted, whereas APAC currencies (except for the Indonesian rupiah and the Indian rupee, which are high yielding) sold off.
Losing Luster
Clients are reducing some of their holdings of LatAm currencies.

Our Take: The Skinny on Obesity Drugs
Our Newton analysts are taking a contrarian view on the obesity-drug craze. Their healthcare team started buying a group of 20 stocks that they believed could outperform on account of what they see as a market overreaction, starting from when they were trading at roughly 15% below their 10-year average historical valuations in late October. Valuations rose 8.7% from Sept. 30 to Dec. 20.
These analysts believe that markets are overly optimistic about the long-term cardiovascular benefits that these drugs will bring. Their analysis suggests that high drug costs will be a barrier to adoption, while side effects will limit duration of treatment. That is why the team is buying up discounted stocks of companies serving diabetes, cardiovascular disease and other obesity-related diseases.
Market Structure

Market Behind on T+1
Analysis of our U.S. custody base shows that roughly a third of trades settled by DTCC may face issues in preparation for the settlement cycle reduction to trade date plus one day (“T+1”). The data show that about 25% of client transactions need to adjust their workflows to meet the new settlement cutoffs. Another roughly 9% would need significant operating model changes by late May to meet the new deadlines. Only two-thirds of client trades currently meet the future deadlines.
Settlement failures could impact the entire trade lifecycle, affecting agent lending, cash management, repo pricing and bank balance sheets. Rather than increasing credit exposure to banks, clients may have to borrow in overnight repos to cover any residual balances on their books and settle in the T+1 timeframe, lowering repo availability and driving up costs. Given all this, market participants might want to prioritize preparations for the new standard.
Tough Timing
Current U.S. eligible transactions by time of settlement receipt show many clients may not be ready for T+1.

Allocations to Hedge Funds Shift
Some 49% of U.S. institutional asset allocators with assets under management of $100 million to $100 billion, polled by Pershing Institutional Solutions in December, said that they would add new investment managers. Reasons included replacing existing strategies with better performing ones and growing their exposures to strategies that are uncorrelated with broader markets. Furthermore, 21% of respondents said they are adding hedge-fund strategies to their portfolios, and 19% said they are replacing underperforming managers with new managers within the same strategy.
Institutional asset managers are also considering resizing their allocations to hedge funds, with some firms increasing and others decreasing. Private equity and private credit are some of the other alternative areas set to benefit from increased allocations, our survey data showed, while many respondents pointed out the large opportunity with hedge funds targeting munis. Where decreases are being considered, the top areas are public-market strategies, including long-only equities and long-only fixed income. This could be another sign of the move away from public markets and into private ones.
Some 21% of respondents said they are adding hedge-fund strategies to their portfolios.
All Cleared Up
The U.S. finalized a rule in December that will expand central clearing for Treasurys by requiring the vast majority of cash and financing trades to be novated to a central counterparty. Market participants continue to digest the roughly 400-page final rule and its implications, but broadly speaking, it will change the way the market functions and how trades are priced.
In the $700 billion-per-day market for routine purchases and sales of cash Treasurys, virtually all trades between dealers and those conducted on interdealer broker platforms will need to be routed through a central counterparty for clearing. In the $4.5 trillion-per-day repo financing market, where roughly a quarter of all private activity is centrally cleared, nearly all transactions will require central clearing, except those with exempt counterparties such as central banks.
The final rule also includes a few new exemptions: cash trades by hedge funds and leveraged accounts, some inter-affiliate repos, and repos by state and local governments will not have to be cleared. Participants have two years to comply (December 2025 for cash trades and June 2026 for repo). Some were expecting that the final rule would include a requirement for minimum margins for repos for all market participants. Under the rule, only FICC members must post margin to the central counterparty, but they can collect that from clients as well under new customer segregated accounts. The official sector may continue to pursue broader use of minimum margins as a companion to the expanded central clearing rule.
In and Out
The majority of the U.S. Treasury market will be centrally cleared, with few exceptions.

Our vantage point comes from:
Touching
20%
of the world’s investable assets*
Safekeeping
$47.8T
in assets (custody and/or administration) as the world’s largest custodian**
Settling
$12.6T
in U.S. government securities daily***
Servicing
$5.7T
average tri-party collateral management balances***
Financing
$4.5T
in lendable securities***
Processing
$2.3T
of U.S. dollar payments value***
Managing
$2.0T
assets under management1**
Investing
$292B
for Wealth Management clients2***