


Q1 2020 Market Disruption: ETFs are a Market Stabilizer

Q1 2020 Market Disruption: ETFs are a Market Stabilizer
June 2020
By Scott Anderson
Market disruptions, to be expected, wreak havoc to packaged-product flows. Through a specialized lens available via BNY Mellon Intermediary Analytics – utilizing data from national, regional and independent broker dealers, and registered investment advisors (RIAs) – we have seen the fund flow landscape turned upside down.
While a number of trends have emerged, one main theme has been the significant volatility in the fund flows of both mutual funds and ETFs. While March 2020 was certainly historic in terms of market losses, it is also helpful to examine the fund flows data in comparison to the fall of 2018, when the market experienced similar volatility.
During a recent webinar exploring these trends, we highlighted the impact of the recent market disruption on the absolute volume of outflows across mutual funds, ETFs, and SMAs. And we examined the data through a number of lenses, identifying different investment behaviors based on the types of advisor programs and outlined our proprietary model of measuring fund demand.
Below are four key insights that we shared with our clients.
1. Market Disruptions Significant in BOTH Q1 2020 and Q4 2018
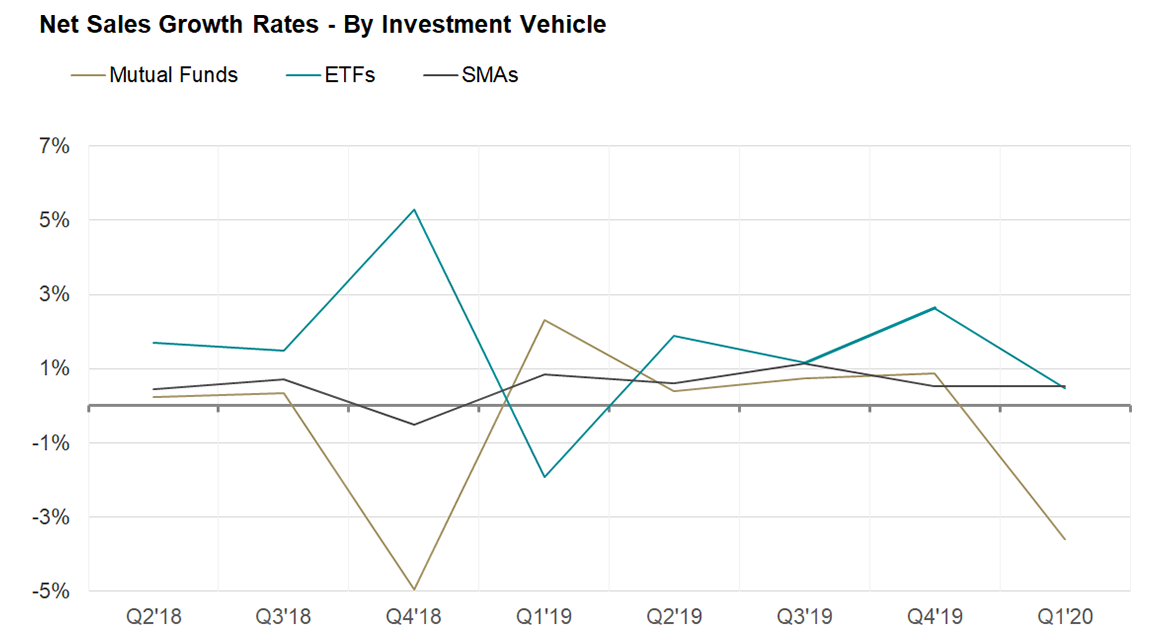
A major difference between Q4 2018 and Q1 2020 was the absolute volume of outflows across all investment vehicles in each period. In Q4 2018, financial advisors’ seasonal practice of tax-loss harvesting coincided with significant market volatility, which created a perfect storm of outflows for mutual funds and SMAs. Mutual funds, at the time, saw outflows of approximately -$50 billion and SMAs saw outflows of -$3 billion. ETFs, on the other hand, saw inflows of $41 billion. This resulted in net outflows across all investment vehicles of -$12 billion.
In Q1 2020, characterized by record market volatility in March, ETFs and SMAs remained relatively flat, while mutual funds saw significant outflows, reaching -$42 billion, resulting in overall outflows of -$36 billion. In Q4 of 2018, for context, ETF growth largely offset mutual fund outflows, a phenomenon that did not repeat itself in Q1 2020.
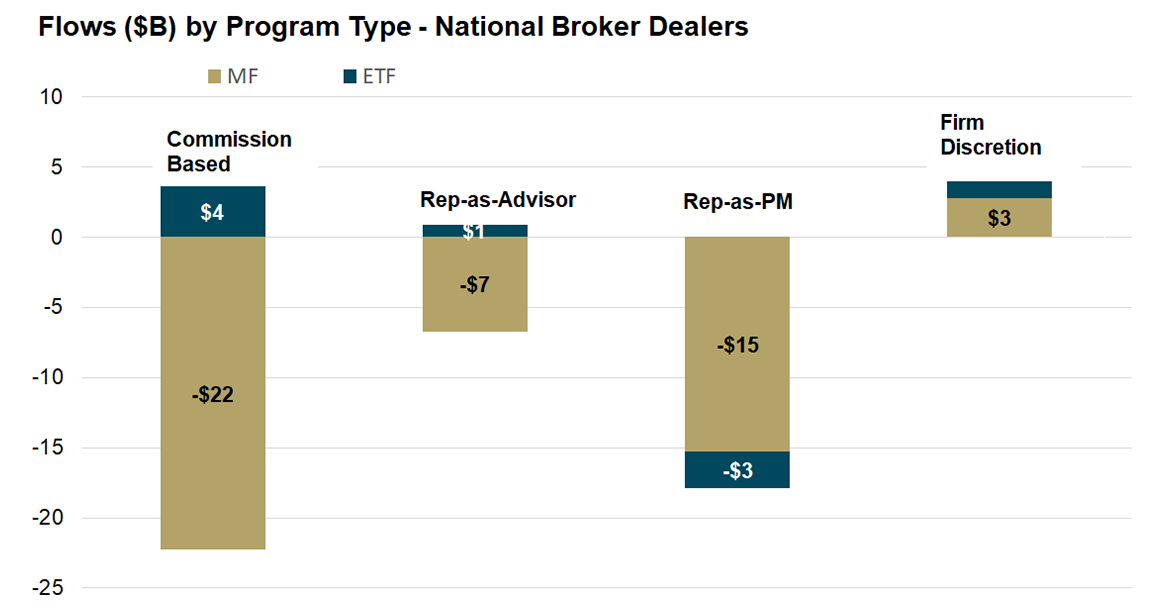
2. Mutual Fund Outflows Most Prominent on Commission-Based and Rep-as-PM Programs
One of the specialized aspects of BNY Mellon Intermediary Analytics data is the ability to explore trends by advisor “program” type. When looking at the market disruptions through this lens two things stand out: first, the continued trend of mutual fund assets moving away from commission-based programs, and second, the continued volatility of Rep-as-PM advisors.
One of the most significant trends over the last 10 years has been the migration from commission-based programs to fee-based programs. The only growth evident through commission-based programs has been in ETFs, which we saw in Q1 2020. In fact, ETFs saw the largest inflows in comparison to fee-based programs.
In both Q4 2018 and Q1 2020, mutual fund outflows on commission-based programs were staggering. It is important to note there was also a great deal of mutual fund outflows on Rep-as-PM programs, especially given the tendency for these advisors to participate in the practice of tax-loss harvesting as mentioned earlier.
However, unlike commission-based programs, Rep-as-PM advisors have also seen periods of sizable growth. In five out of the last eight quarters, these fully discretionary advisor-driven programs saw the highest net sales, the exceptions being in Q4 2018 and Q1 2019. In comparison, over the last 15 months, commission-based programs have seen a steady rate of mutual fund outflows and a significant increase in money market assets/flows.
One additional differentiating factor between these two program types is respective money market penetration. While money market funds do not have any sort of presence on fee-based advisory programs, their assets have seen significant growth over the last 15 months on commission-based programs. Money market growth is viewed as “money in motion” amidst the move to fee-based managed account structures.
3. Drivers of Demand Relatively Consistent
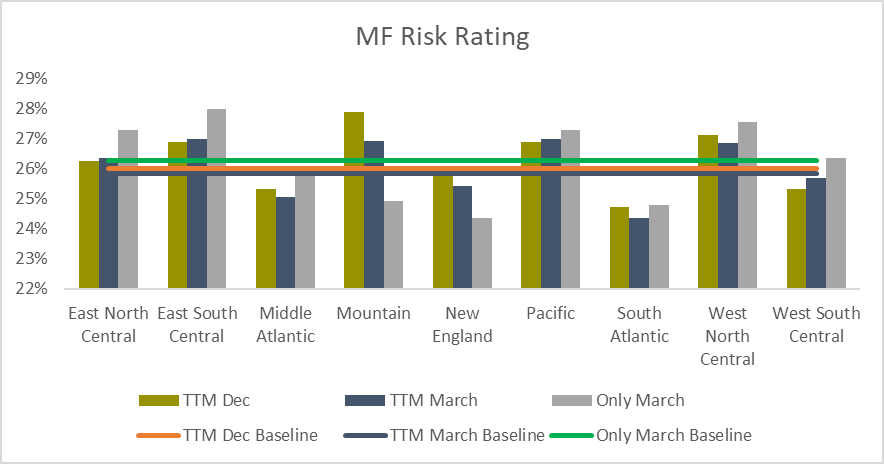
Another important and innovative way to measure the effect of the 2020 market disruption is through proprietary models within our new Distribution Analytics application. Our analysis shows that the drivers of demand for mutual funds and ETFs changed between the trailing 12 months (TTM) December 2019 and TTM March 2020. This analysis measures demand for funds that have high and above-average performance ratings; funds with high and above-average risk ratings; and funds with five- and four-star Morningstar ratings, all of which were evaluated to determine if they were stable drivers of demand.
A few key findings, include:
- Demand for above-average and high-performance rated products have remained consistent across multiple model refreshes. This indicates that performance remains a stable driver of demand.
- The demand preference for mutual funds rated in the “High Risk” and “Above Risk” categories by Morningstar were lower than average in certain geographic areas, such as the Mid-Atlantic, New England, and South Atlantic geographies, across all time periods.
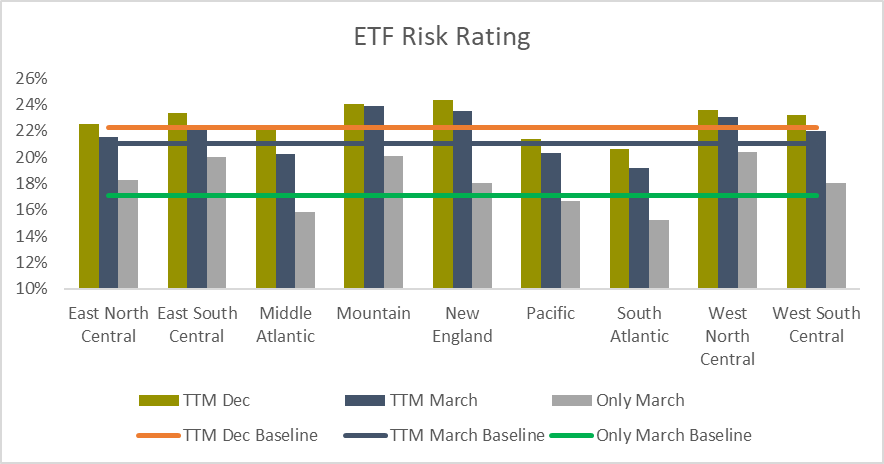
- The demand preference for ETFs rated in the “High Risk” and “Above Risk” categories by Morningstar was more consistent across the US markets and aligns with the national average. However, during the month of March, we did find a downward shift in demand for ETFs in these higher risk rated categories (5% points). In addition, the Mid Atlantic and South Atlantic areas displayed an overall lower preference for higher rated risk products as compared to the rest of the country.
4. Advisors Turned to US Equity ETFs, Particularly Index and Smart Beta products at the National Broker Dealers
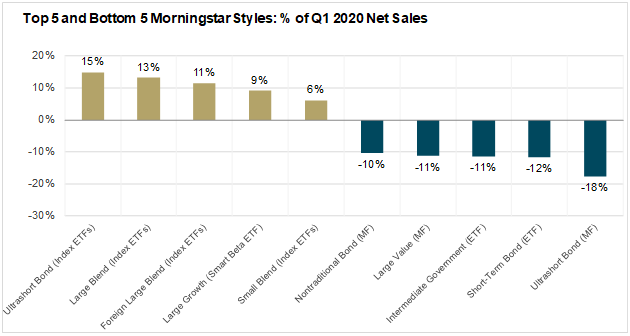
Amid the historic market volatility and outflows, there were a few specific areas of growth in Q1 2020. Focusing on fee-based programs, taxable fixed income took the biggest hit with overall outflows for both mutual funds and ETFs, while US equity ETFs and SMAs saw positive net sales for the quarter. US Equity ETF growth was led by Large-cap Blend ETFs (Index), Large-cap Value ETFs (Smart Beta), and Large-cap Growth ETFs (Smart Beta). Overall, 75% of US Equity ETFs went to index/market cap products, 23% to Smart Beta, and 2% to active ETFs.
While US equity ETFs saw the most growth as an asset class, by far the most activity revolved around fixed income for both mutual funds and ETFs. The largest overall inflows were to ultrashort bond ETFs and the largest outflows came from ultrashort bond mutual funds
Takeaways
In the two most recent bouts of significant market volatility (Q1 2020 vs. Q4 2018), ETFs have been a resilient source of stability in the market. Our analysis shows that commission-based programs, where mutual fund assets are dwindling and money market assets are entrenched, ETFs have seen steady growth.
While mutual funds have experienced the most prominent outflows within commission-based and Rep-as-PM programs, one thing to keep an eye on in the future is money market funds’ continued penetration in commission-based programs. For fully discretionary advisor-driven programs, it will be interesting to monitor whether their run of growth in terms of net sales continues as volatility subsides.
As asset managers look to gain a better understanding of how advisors are leveraging a combination of active and passive strategies, it’s critical to arm sales, marketing and product teams with actionable data-driven insights. One central theme in the industry has been the increased importance of using data across these respective groups to ultimately help drive sales efforts.
To that end, BNY Mellon will continue to provide clients with insightful, relevant analysis through its Intermediary Analytics solutions. BNY Mellon Data and Analytics Solutions integrates the resources of Intermediary Analytics, Eagle products, and other BNY Mellon technology and data assets to build client-centric technology and content solutions. By providing distribution trend analysis, the Intermediary Analytics solutions will help clients understand the drivers behind advisors’ use of active and passive products, which can be an important first step when engaging with financial advisors.

BNY Mellon is the corporate brand of The Bank of New York Mellon Corporation and may be used to reference the corporation as a whole and/or its various subsidiaries generally. This material does not constitute a recommendation by BNY Mellon of any kind. The information herein is not intended to provide tax, legal, investment, accounting, financial or other professional advice on any matter, and should not be used or relied upon as such. The views expressed within this material are those of the contributors and not necessarily those of BNY Mellon. BNY Mellon has not independently verified the information contained in this material and makes no representation as to the accuracy, completeness, timeliness, merchantability or fitness for a specific purpose of the information provided in this material. BNY Mellon assumes no direct or consequential liability for any errors in or reliance upon this material.
BNY Mellon will not be responsible for updating any information contained within this material and opinions and information contained herein are subject to change without notice.
BNY Mellon assumes no direct or consequential liability for any errors in or reliance upon this material. This material may not be reproduced or disseminated in any form without the prior written permission of BNY Mellon. Trademarks, logos and other intellectual property marks belong to their respective owners.
© 2020 The Bank of New York Mellon Corporation. All rights reserved.