


A Look at Fee-based Fund Flow Trends
U.S. Distribution Pulse Quarterly Snapshot | Q4 2022

A Look at Fee-based Fund Flow Trends
U.S. Distribution Pulse Quarterly Snapshot | Q4 2022
December 2022
By Scott Anderson
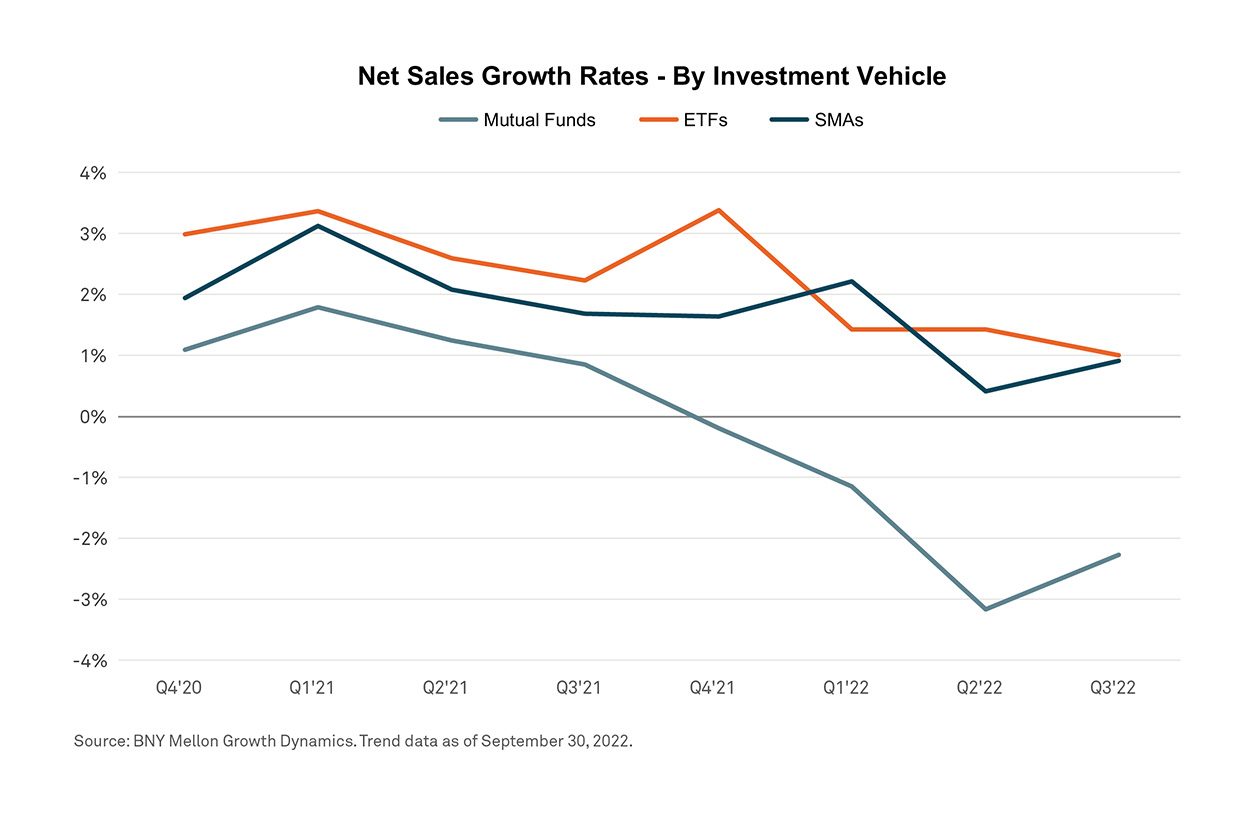
Market conditions in Q3 2022 continued to put stress on fee-based sales and net flows in the national broker-dealer space.* Mutual funds (MFs) continued to see historically low net sales growth rates. By contrast, both exchange-traded funds (ETFs) and separately managed accounts (SMAs) showed signs of stabilizing from their earlier peak declines. Shifts between asset classes and differences between investment styles have played a significant role in helping ETFs and SMAs realize positive net flows, including a slight increase in net flows for SMAs.
The Q3 data on fee-based sales and flows show three overarching trends:
• Net flows see continued but slowing declines.
• Fixed income plays an outsized role in stabilizing ETFs and SMAs.
• There are pockets of growth in both active and passive products.
Net flows see continued but slowing declines
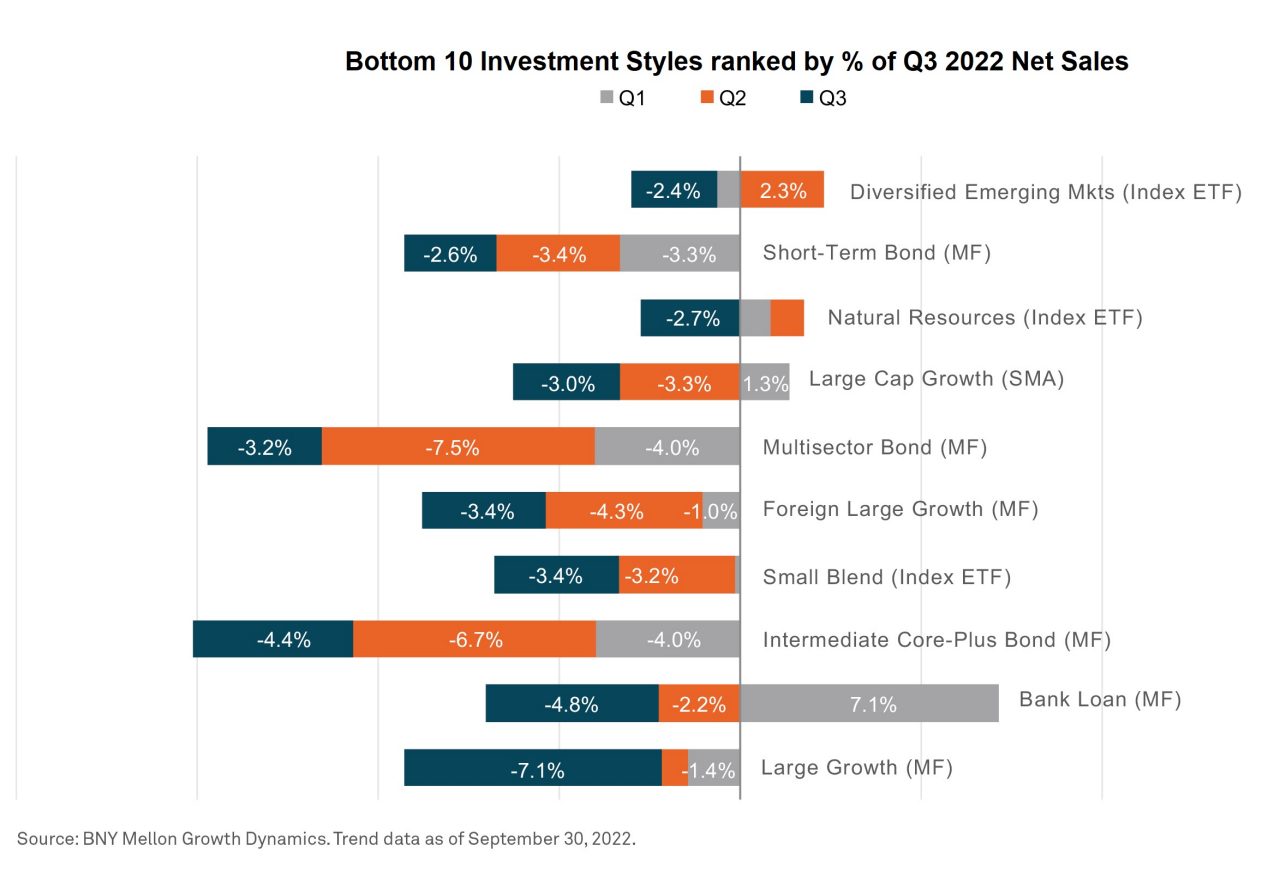
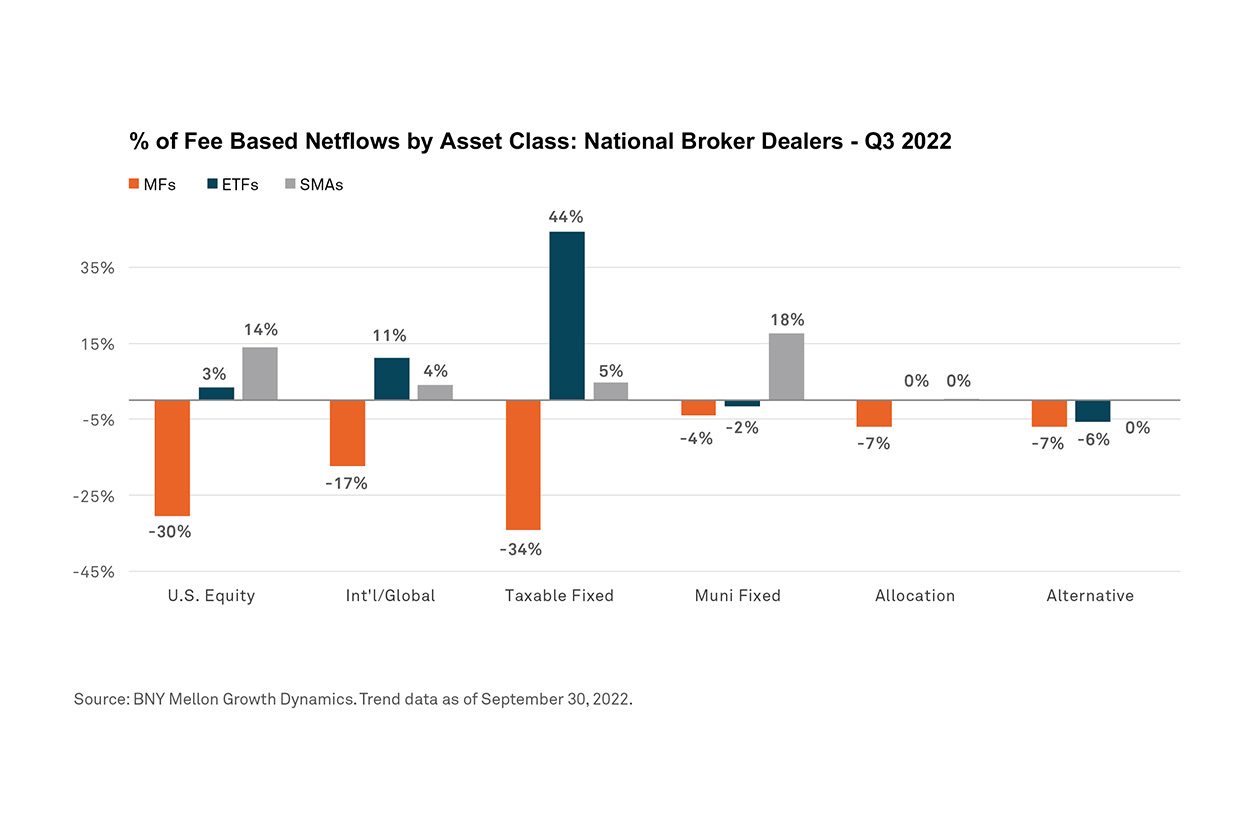
Outflows for MFs alleviated somewhat in Q3, slowing from $43 billion in Q2 to $30 billion. However, the most recent data still reflect historical lows. MFs saw net outflows across U.S. and Global Equities (30% and 17% of outflows, respectively), as might be expected based on market conditions. Fixed Income MFs continued their trend of garnering sizable outflows once again, with taxable Fixed Income at 34% of net outflows.
ETFs and SMAs tell a different story. While ETF net inflows declined from $15 billion in Q2 to $10 billion, SMAs saw a slight increase in flows, reaching $6 billion in net inflows for Q3. For both, Fixed Income provided lift. Long and Intermediate Government Index ETFs drove ETF inflows, while U.S. Equity ETFs saw the lowest sales since Q2 2020. For SMAs, Muni Fixed Income SMA net sales eclipsed U.S. Equity, although direct index products provided additional lift within SMAs.
Fixed Income plays an outsized role in stabilizing ETFs and SMAs
Broad macroeconomic and geopolitical concerns seemingly kept equity market products at a significant disadvantage across the board. The impact of Fixed Income in the ETF space helps illustrate the trend. Long Government Index ETFs were the top investment style, at 8.4% of fee-based quarterly net sales in Q3 2022. Sales in this category were concentrated in a small number of products. On the other hand, Large Blend Index ETFs barely climbed into the top 20 investment styles with 1.6% of net sales, a significant departure from its historic position as a key contributor to ETF sales.
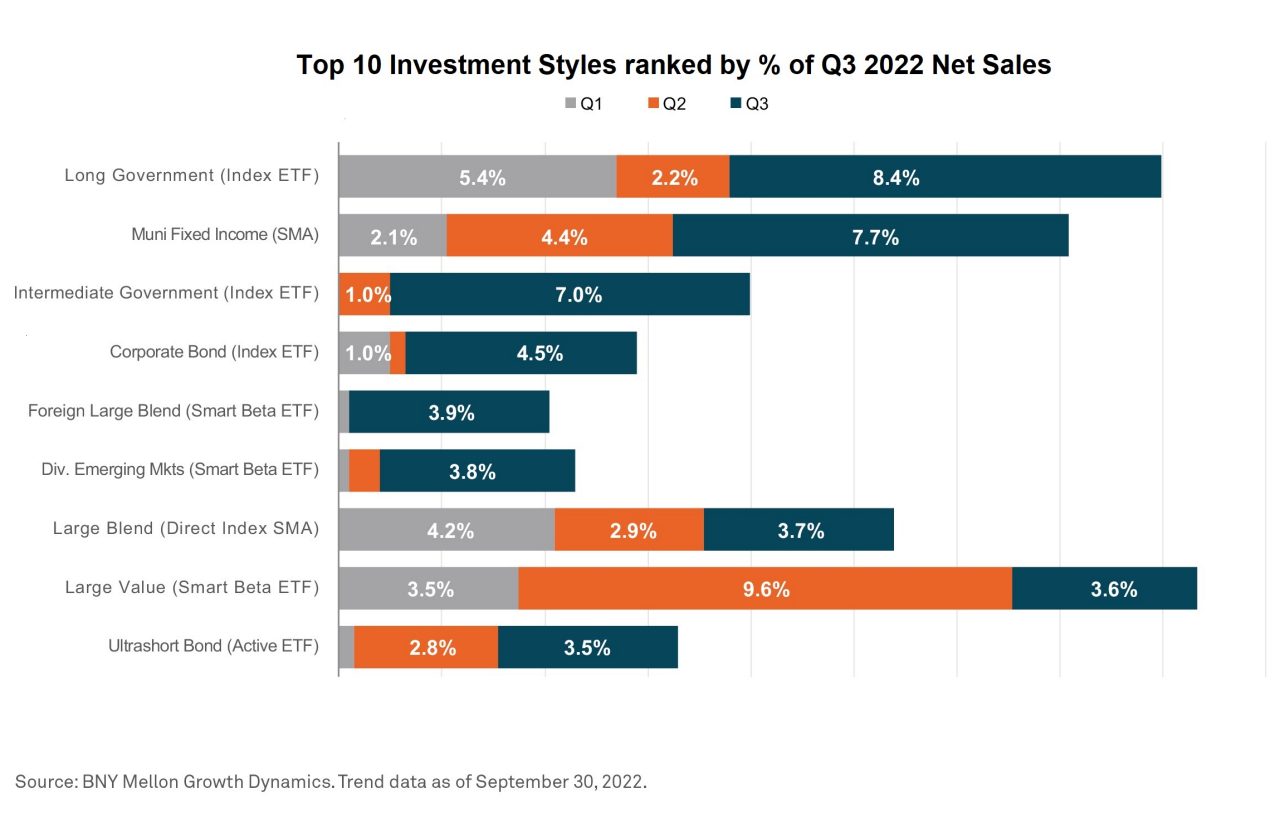
SMAs followed a different pattern in shares by investment style, with Muni Fixed Income in second place overall (7.7%) and Large Blend Direct Index at seventh (3.7%). This ranking, as the primary Direct Index strategy in the top 10, is consistent with the rising role played by SMAs among fee-based products.
There are pockets of growth in both active and indexed strategies
Fund flow data for Q3 shows that active and indexed strategies have created growth opportunities for ETFs and SMAs.
Three of the top five selling ETF styles were Fixed Income Index, representing 34% of positive net sales. In addition, Index and Smart Beta sales were relatively equal for the second consecutive quarter. Large Cap Value had the majority of Smart Beta ETF assets with 32%.
Large Cap Value and Muni Fixed Income also attracted significant assets and sales for SMAs. Interestingly, Muni sales exceeded U.S. Equity SMA for the first time in over three years. Direct Index strategies also buoyed U.S. Equity SMA offerings. While representing only 5% of U.S. equity assets under management, Direct Index SMAs delivered 62% of U.S. equity net sales. This position is not a surprise as investor customization and tax efficiency have seemingly been important themes for investors, making managed accounts an attractive vehicle.
Rotation Likely to Continue
By the last day of Q3 2022, the S&P 500 and Dow Jones reached their low point for the year, with NASDAQ close behind in declines. These equity market conditions have prompted a flight to safety. At the same time, fee-based products are contending with a secular trend putting pressure on fees.
In this context, fund flow trends continue to move in favor of ETFs and SMAs—regardless of asset types and investment styles. Distribution professionals should consider the implications of this ongoing rotation in the quarters and years ahead. The data seems to suggest that the fund flow rotation that took hold in the first half of 2022 will likely continue.
For more on these trends and what’s emerging, listen to BNY Mellon’s U.S. Distribution Pulse Quarterly webcast.

All data is sourced from BNY Mellon Growth Dynamics as of September 30, 2022, unless otherwise stated. The aggregate data used in this analysis is based on Mutual Fund, ETF and SMA asset and sales data reported to BNY Mellon Growth Dynamics under a data sponsor agreement. Data currently representing approximately $3.5 trillion in assets under management with national broker-dealers. The data set represents sales through a financial advisor and excludes institutional and retirement plan sales.
BNY Mellon is the corporate brand of The Bank of New York Mellon Corporation and may be used to reference the corporation as a whole and/or its various subsidiaries generally. This material does not constitute a recommendation by BNY Mellon of any kind. The information herein is not intended to provide tax, legal, investment, accounting, financial or other professional advice on any matter, and should not be used or relied upon as such. The views expressed within this material are those of the contributors and not necessarily those of BNY Mellon. BNY Mellon has not independently verified the information contained in this material and makes no representation as to the accuracy, completeness, timeliness, merchantability, or fitness for a specific purpose of the information provided in this material. BNY Mellon assumes no direct or consequential liability for any errors in or reliance upon this material.
BNY Mellon will not be responsible for updating any information contained within this material and opinions and information contained herein are subject to change without notice.
BNY Mellon assumes no direct or consequential liability for any errors in or reliance upon this material. This material may not be reproduced or disseminated in any form without the prior written permission of BNY Mellon. Trademarks, logos and other intellectual property marks belong to their respective owners.
© 2022 The Bank of New York Mellon Corporation. All rights reserved.