


2022 H1 Flows - Top Trends
U.S. Distribution Pulse Quarterly | 3Q 2022

2022 H1 Flows - Top Trends
U.S. Distribution Pulse Quarterly 3Q 2022
October 2022
By Scott Anderson and Don Mam
The market uncertainty in the first half of 2022 showed no signs of abating. Significant volatility and the turbulent response to intractable inflation affected flows and dragged down assets for a second consecutive quarter across all three product types. Exchange traded funds (ETFs) and separately managed accounts (SMAs) survived the market downturn with positive growth, while mutual funds (MFs) saw historic outflows.
That being said, this type of MF outflow has occurred before, specifically during the last two major market disruptions, Q4 of 2018 and Q1 of 2020. And on a positive note, ETFs and SMAs have shown a bit more variation in response to market disruptions. For example, ETFs saw strong sales on Rep-as-PM and Firm discretionary programs.
Analysis of MF, ETF and SMA asset and sales data from national broker dealers from BNY Mellon Growth DynamicsSM can identify several key trends for advisors and investment and wealth managers:
Below are some of the top trends in the first half of 2022:
- U.S. equity growth was driven by smart beta ETFs
- Index ETFs were a resilient area of fixed income growth accounting for 16% of net sales while MFs saw historic outflows
- SMA flows were down sharply but strong with flows increasing over previous downturns
1.
U.S. Equity Growth Was Driven by Smart Beta ETFs
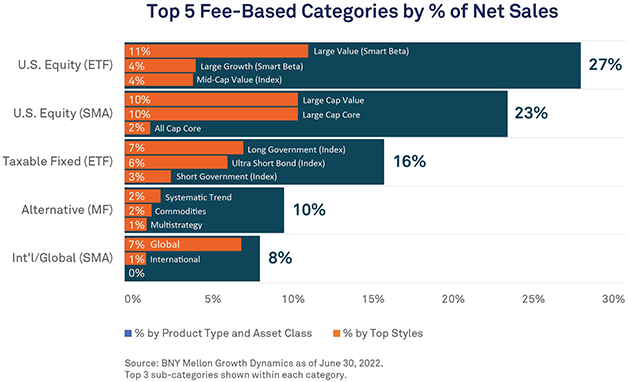
U.S. equity flows up to mid-year showed little surprise in some respects as volatility weighed down on fund flows. Both ETFs and SMAs managed solid growth though, with U.S. equity SMAs accounting for 23% of net sales in the first half of 2022. Notably, ETFs led with 27% of net sales in the first half and nearly doubled their sales with respect to SMAs in the second quarter, which is a reverse of last quarter.
Smart beta ETFs were responsible for the bulk of ETF sales growth, accounting for 93% of ETF sales in Q2 2022. These were the most sales smart beta ETFs saw relative to index ETFs in many years. Large value continues to be the driving force behind smart beta ETF growth. The category accounted for 11% of net sales and was the top investment style overall. However, against the search for dividend yield and less risky assets, smart beta ETFs also supported large growth, which accounted for 4% of net sales.
For active ETFs in the current market environment, income generating and active ETFs drove sales. Specifically, JP Morgan JEPI, a derivative income launched in May 2020, saw significant sales the last two quarters.
2.
Index ETFs Were a Resilient Area of Fixed Income Growth
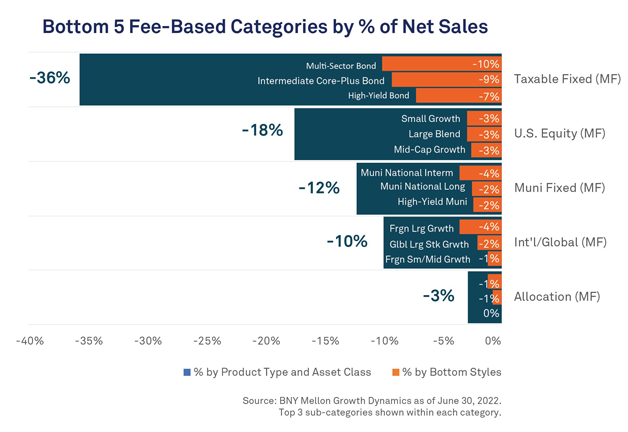
A key theme around fund flows in the first half of 2022 was the resilience of ETFs, as they navigated volatile fixed income markets with success. The market shunned taxable fixed income MFs to the tune of -36% net sales in the first half of 2022 but directed 16% of net sales to taxable fixed income ETFs, with sales more than double between the first and second quarter.
The vast majority of these sales were in index ETFs. The top styles among index ETFs showed a mix of duration exposure but a consistent focus on quality. Long government and short government were among the top styles and accounted for 7% and 3% of net sales respectively. Ultrashort bonds also attracted strong growth, with 6% of net sales and were consistently strong for both Index ETFs and Active ETFs.
3.
SMA Flows Down Sharply But Strong
The stability of ETFs and displacement of MFs over downturns is not a recent acquirement. ETFs have remained relatively impervious to market uncertainty and have proven to be a source of stability versus MFs in outflow. Now, though, liquid alternatives provide the only source of positive growth for MFs. Also, SMAs have followed an increasingly resilient path, thanks to greater adoption.
Historically, SMAs were driven by equities, and though there’s been a sharp decrease in SMA flows, it’s mostly in equities and partly due to an all-time historic high in Q1 2022, but flows remained positive in contrast to outflows in Q1 2020 and Q4 2018. While SMA sales varied between strategies, direct index SMAs saw less of a decrease compared to “active” SMA strategies. Notably, direct index SMAs made up 19% of U.S. equity sales and 8% of total net sales in Q2 2022.
Relatedly, ESG funds saw outflows across nearly all major asset classes for ETFs and MFs, but SMAs continued to attract positive sales in Q2 2022, mostly due to large growth strategies. Muni fixed income was also a source of growth for SMAs in the last quarter.

All data as of June 30, 2022 unless otherwise stated.
BNY Mellon is the corporate brand of The Bank of New York Mellon Corporation and may be used to reference the corporation as a whole and/or its various subsidiaries generally. This material does not constitute a recommendation by BNY Mellon of any kind. The information herein is not intended to provide tax, legal, investment, accounting, financial or other professional advice on any matter, and should not be used or relied upon as such. The views expressed within this material are those of the contributors and not necessarily those of BNY Mellon. BNY Mellon has not independently verified the information contained in this material and makes no representation as to the accuracy, completeness, timeliness, merchantability or fitness for a specific purpose of the information provided in this material. BNY Mellon assumes no direct or consequential liability for any errors in or reliance upon this material
BNY Mellon will not be responsible for updating any information contained within this material and opinions and information contained herein are subject to change without notice.
BNY Mellon assumes no direct or consequential liability for any errors in or reliance upon this material. This material may not be reproduced or disseminated in any form without the prior written permission of BNY Mellon. Trademarks, logos and other intellectual property marks belong to their respective owners.
© 2022 The Bank of New York Mellon Corporation. All rights reserved.