


Don Mam
Research Analyst, BNY Mellon Growth DynamicsSM

U.S. Distribution Pulse Snapshot

U.S. Distribution Pulse Snapshot
June 2022
By Scott Anderson and Don Mam
After a year of stable market conditions, volatility ramped up in Q1 2022. Advisors selectively parsed uncertainty, resulting in an imbalance of fee-based flows across mutual funds (MFs), exchange- traded funds (ETFs), and separately managed accounts (SMAs). On the surface, flows played out as one may have expected. However, unraveling each product type by asset class and style reveals important themes and surprises that shaped fee-based flows in the quarter, which seemed to reflect defensive movement as well as creative strategies among advisors to counter the market distress.
The charts below focus on fee-based flow activity in the top 5 and bottom 5 categories based on data from national broker-dealers, which help define distribution strategies over a short- and long-term view within these three top trends:
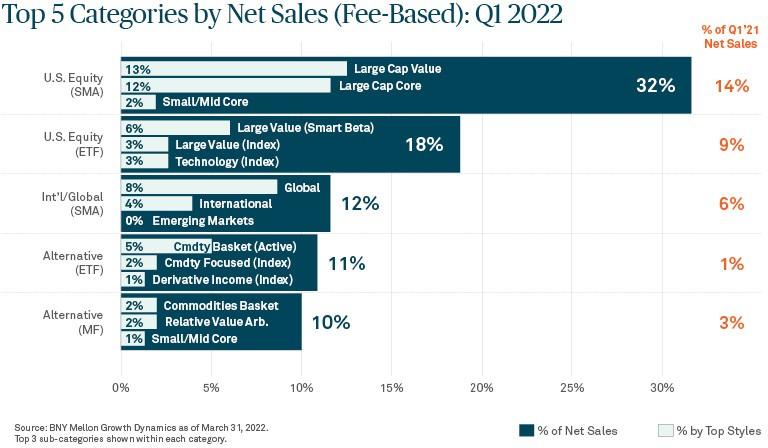
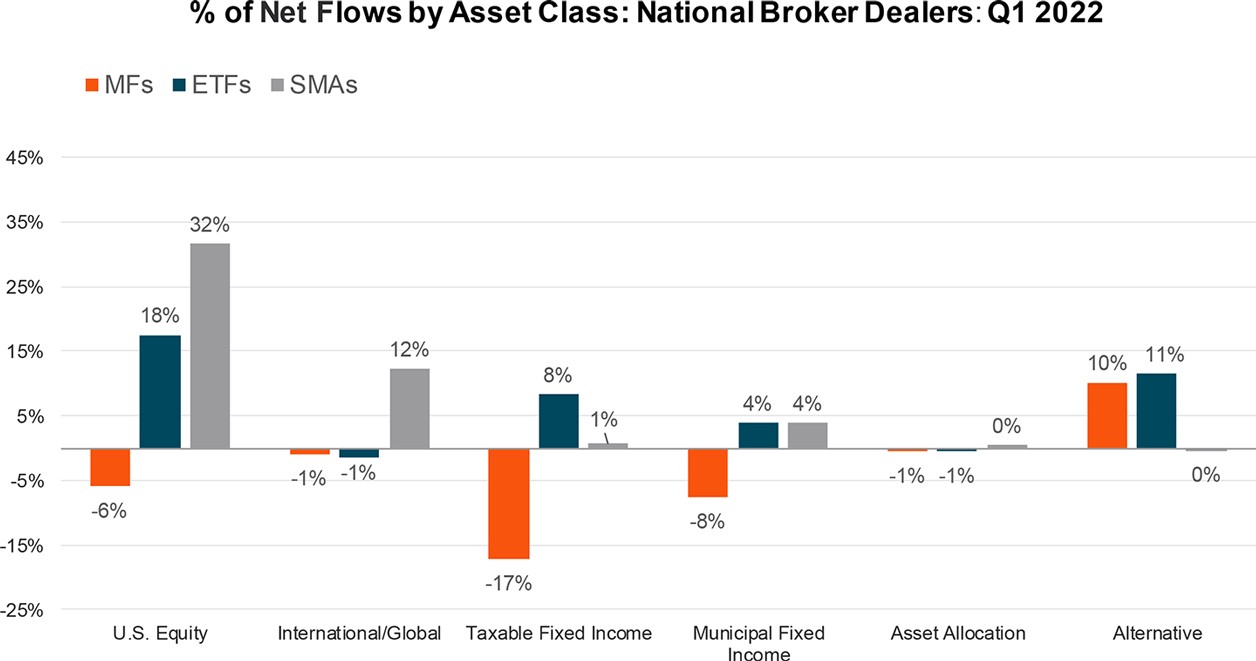
Equity markets faced an unpredictable outlook to start the year as an array of macroeconomic factors led to heightened volatility. Despite these conditions, significant U.S. equity flows continued to go to ETFs and SMAs. U.S. equity ETFs accounted for 18% of net sales, while U.S. equity SMAs led all categories with 32% of net sales and posted a record high in sales over the past five years. The majority of U.S. equity SMA sales were in active strategies, but notable growth was seen in direct index strategies, which accounted for 21% of U.S. equity sales to SMAs. SMAs also saw gains in international/global equity strategies.
Drilling down by style, U.S. equity SMA sales were driven by large cap value, which led all other investment styles with 13% of net sales. Large value was also a consistent top style in smart beta ETFs and index ETFs. While a shift from large growth to large value remains underway, some advisors straddled between growth and value, and opted for large cap core SMAs – the second-best selling investment style with 12% of net sales.
Rising rates continued to create instability in the fixed-income market, causing MF growth to deteriorate. MFs saw significant outflows ($40 Billion) from municipal and taxable fixed income – the first outflows to both MF categories since the onset of COVID-19 in Q1 2020. Municipal fixed income MFs showed an 8% decline in net sales, while taxable fixed-income MFs took the brunt of outflows, with a decline in net sales of 17% in the quarter. This was a sharp reversal from last year when taxable fixed-income MFs accounted for the highest percentage of net sales.
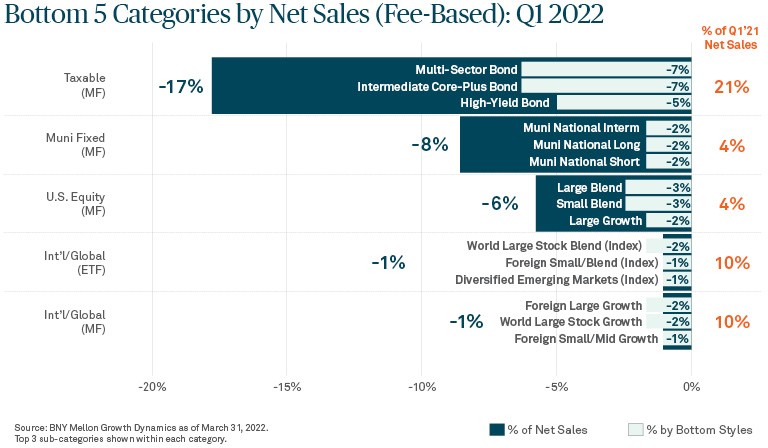
Multi-sector bond, intermediate core plus bond, and high-yield bond saw the largest outflows, a trend consistent for many other taxable fixed income styles outside of the bottom 5 shown in the chart. The only taxable fixed-income MF style to see considerable inflows was bank loan, which offers investors a safe haven against a rising rate environment using floating yields.
With increased risk in the equity and fixed-income market, alternatives, which tend to have low correlation with equities and fixed-income, gained considerable momentum to start the year. This was reflected in significant sales in alternative MFs and ETFs. MFs were in outflows across most major asset classes, with the exception of alternatives, which represented 10% of net sales in the quarter. Alternatives saw slightly higher sales to ETFs with 11% of net sales.
When analyzing ETF flows by management type, it was active ETFs that garnered the majority of alternative sales to ETFs. Active ETFs accounted for 61% of total ETF sales, with the more thematic strategies underpinning growth in the category. This was also – the first quarterly increase to active ETF sales since Q1 2021 – an important shift to monitor considering active ETF growth has largely been concentrated around taxable fixed income.
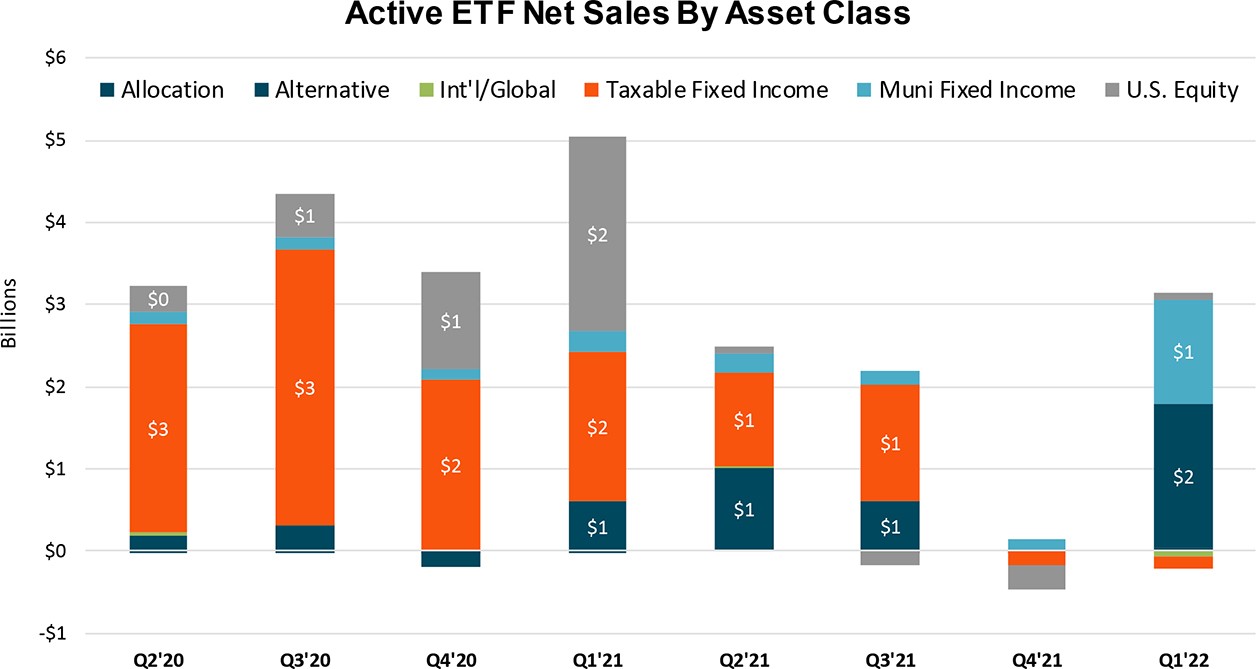
In terms of styles, commodities broad basket was the top style in active ETF sales and the alternative MF category. Commodities broad basket, which can include exposures to metals, energy and grains, has benefited from rising inflation as prices surged and have remained relatively high. In addition to the commodities-fueled growth in the alternatives category, the “ultra-short” municipal bond segment also saw tremendous interest based on Q1 inflows. In unpacking the data, this was driven by one product that enjoyed disproportionate home-office model sales during the quarter.
Environmental, social governance (ESG) strategies, while a relatively minor percentage of inflows, continued to show sales growth, underscoring the category’s resiliency despite the market turbulence.
Close Look at Active ETFs by Style and Top Products

The data seem to suggest that a rotation of fund flows is underway, with the recent market environment challenging traditional asset allocation strategies. While these positions may be tactical in nature, fund flows in Q1 2022 also reveal accelerating trends that distribution professionals would be wise to monitor in 2022 and beyond, including trends in active ETF and SMA strategies, categories that thrived over the past quarter.
For more on these trends and what’s emerging, listen to BNY Mellon’s U.S. Distribution Pulse Quarterly webcast.

Scott Anderson
Director of Research, BNY Mellon Growth DynamicsSM
Don Mam
Research Analyst, BNY Mellon Growth DynamicsSM
BNY Mellon is the corporate brand of The Bank of New York Mellon Corporation and may be used to reference the corporation as a whole and/or its various subsidiaries generally. This material does not constitute a recommendation by BNY Mellon of any kind. The information herein is not intended to provide tax, legal, investment, accounting, financial or other professional advice on any matter, and should not be used or relied upon as such. The views expressed within this material are those of the contributors and not necessarily those of BNY Mellon. BNY Mellon has not independently verified the information contained in this material and makes no representation as to the accuracy, completeness, timeliness, merchantability or fitness for a specific purpose of the information provided in this material. BNY Mellon assumes no direct or consequential liability for any errors in or reliance upon this material. BNY Mellon will not be responsible for updating any information contained within this material and opinions and information contained herein are subject to change without notice. BNY Mellon assumes no direct or consequential liability for any errors in or reliance upon this material. This material may not be reproduced or disseminated in any form without the prior written permission of BNY Mellon. Trademarks, logos and other intellectual property marks belong to their respective owners. © 2022 The Bank of New York Mellon Corporation. All rights reserved.