


A Year of Persistent Distribution Shifts
U.S. Distribution Pulse Quarterly | 1Q 2023

A Year of Persistent Distribution Shifts
U.S. Distribution Pulse Quarterly 1Q 2023
March 2023
By Scott Anderson
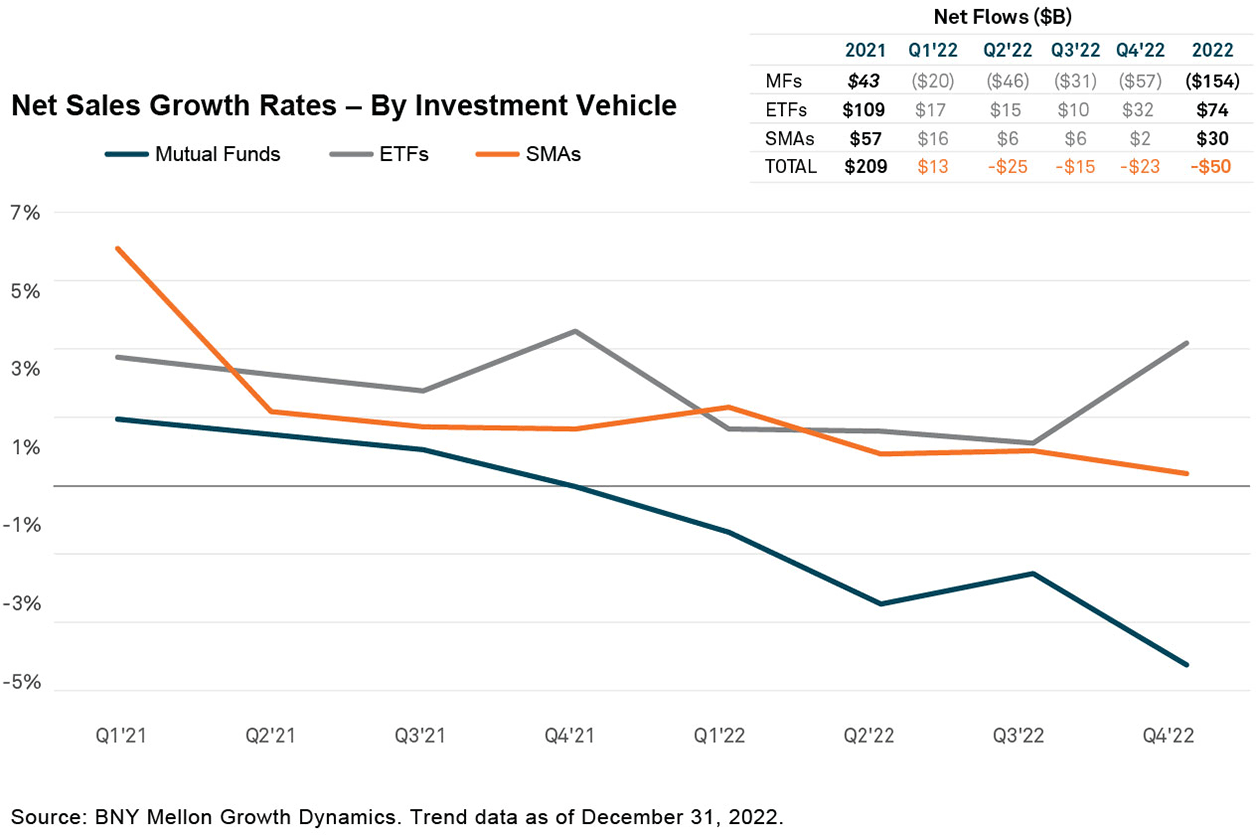
The distribution landscape for packaged products remained broadly consistent throughout 2022, according to BNY Mellon Growth DynamicsSM data.1 However, a new year of complex market and macroeconomic conditions lies ahead. As a result, it remains to be seen whether the 2022 trend represents a longer-term structural shift among packaged products or simply an adjustment phase in a changed environment.
Across products, mutual funds experienced historic net outflows quarter over quarter in 2022, reaching the deepest rate of decline in the past five years. They dipped to under 50% of total assets for packaged products for the last two quarters of the year.
However, ETFs and SMAs provided some upward momentum. Despite slowing growth in general, they saw net inflows. In Q4, ETF inflows grew by 3.5%. Fourth-quarter lifts are common as managers look to harvest tax losses.
Below are the three main trends driving flows in 2022:
- Fixed income plays an increasing role in driving sales shifts
- Smart beta ETFs and direct index SMAs provide lift to U.S. equities
- Active ETFs still include select bright spots
The Increasing Role of Fixed Income
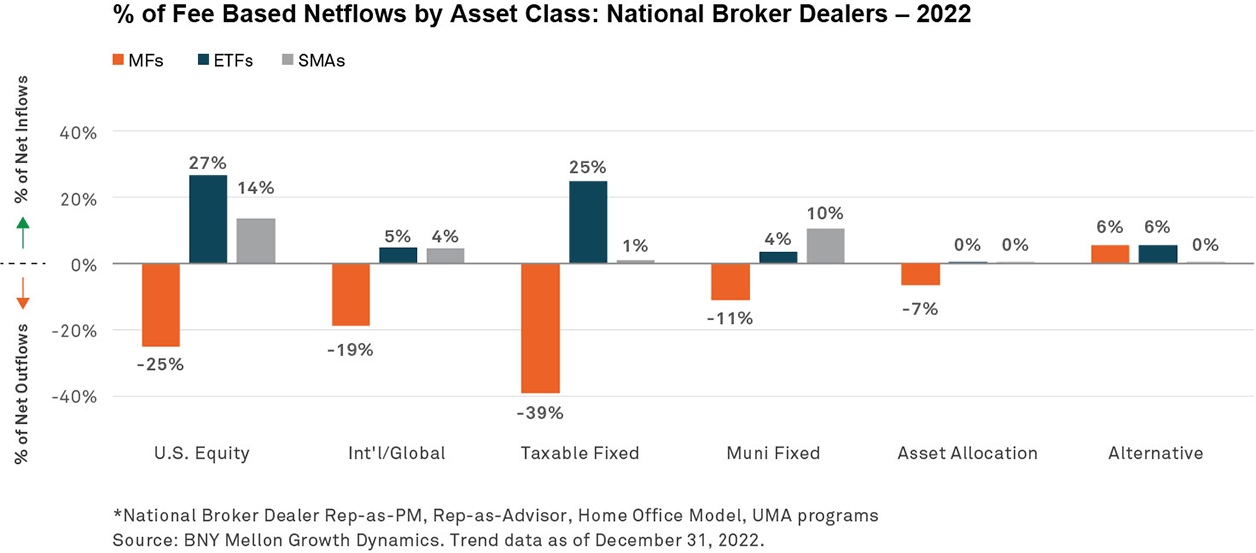
Fixed-income SMAs and ETFs experienced strong flows in the second half of 2022, with muni fixed income as the top-selling SMA style for the full year. Overall, taxable fixed-income mutual funds saw the sharpest drop.
Long government index ETFs delivered consistent flows throughout the third and fourth quarters. These products also saw significant sales within the home-office model and rep-as-portfolio-manager programs, demonstrating the considerable effect these fixed-income investments had on overall advisory flows. This impact applies whether advisors have discretion over investments or if investments are included in firm discretionary models.
Fixed income also offered one of the few positive stories for mutual funds, where intermediate core bond and liquid alternatives provided pockets of growth, even as core plus and multisector shrank significantly.
U.S. Equity Lift From Smart Beta and Direct Index
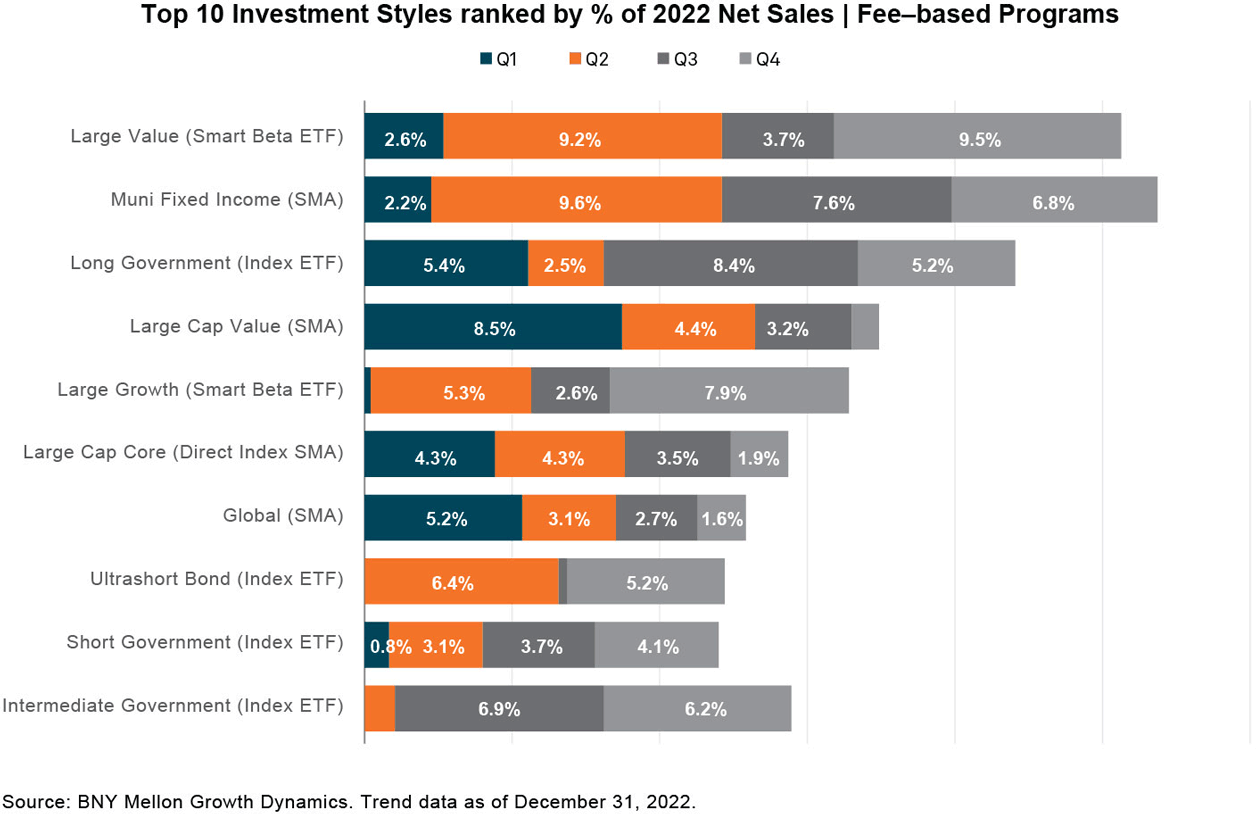
In 2022, 56% of overall ETF sales went to index, 35% to smart beta and 9% to active. However, 64% of U.S. equity sales went to smart beta ETFs. Long U.S. government index ETFs had consistent flows throughout the third and fourth quarters.
Conversely, large value ETFs rebounded from a tough third quarter (3.7% of net sales) to reach their highest percentage of net sales (9.5%) for the year in the fourth quarter.
Despite making up only 4% of SMA assets, direct index SMAs (mainly large cap core) generated 17% of SMA net sales in 2022. This weighting highlights the popularity of the direct index approach within SMAs. While their growth was down in H2 2022, direct index continued to drive U.S. equity SMA sales, exceeding non-index U.S. equity SMA sales by a factor of four in the second half of 2022. Unusually, active U.S. equity SMAs saw outflows of $1 billion in the fourth quarter, a sharp reversal from the first quarter’s $8 billion in inflows.
It is an open question whether smart beta products will pull more flows from mutual funds and SMAs in the coming quarters, just as they did in the third quarter. This migration could indicate a longer-term structural change.
Bright Spots Within Active ETFs
Active ETFs were generally not immune to the recent slowdown in ETF flows. Active ETFs saw a dramatic decrease in net sales beginning in Q1 2022, similar to the trend we saw in 2021. Alternative active ETFs (derivative income) comprised the vast majority of active ETF net flows in 2022, although almost 40% of active ETF assets were held in short and ultrashort duration strategies. Active ETF net sales across both U.S. equity and fixed income are still concentrated among a few very large tickers. Short government, core-plus and technology active ETFs all experienced notable outflows.
Watching for Rebound Effects
Tax-loss harvesting can potentially disrupt or disguise secular trends. If data from the first quarter of 2023 show rebound effects, we may see some recovery in SMAs and mutual funds. Over the past two years, these kinds of rebounds emerged from fixed income rather than equities. The coming months will provide critical data for managers looking to offer new packaged products.
For the Q1 2023 U.S. Distribution Pulse Quarterly on-demand webcast, click here.

1All data is sourced from BNY Mellon Growth Dynamics as of December 31, 2022. The aggregate data used in this analysis is based on Mutual Fund, ETF and SMA asset and sales data reported to BNY Mellon Growth Dynamics under a data sponsor agreement. Data currently representing approximately $3.7 trillion in assets under management with national broker-dealers. The data set represents sales through a financial advisor and excludes institutional and retirement plan sales.
BNY Mellon is the corporate brand of The Bank of New York Mellon Corporation and may be used to reference the corporation as a whole and/or its various subsidiaries generally. This material does not constitute a recommendation by BNY Mellon of any kind. The information herein is not intended to provide tax, legal, investment, accounting, financial or other professional advice on any matter, and should not be used or relied upon as such. The views expressed within this material are those of the contributors and not necessarily those of BNY Mellon. BNY Mellon has not independently verified the information contained in this material and makes no representation as to the accuracy, completeness, timeliness, merchantability or fitness for a specific purpose of the information provided in this material. BNY Mellon assumes no direct or consequential liability for any errors in or reliance upon this material.
BNY Mellon will not be responsible for updating any information contained within this material and opinions and information contained herein are subject to change without notice.
BNY Mellon assumes no direct or consequential liability for any errors in or reliance upon this material. This material may not be reproduced or disseminated in any form without the prior written permission of BNY Mellon. Trademarks, logos and other intellectual property marks belong to their respective owners.
© 2023 The Bank of New York Mellon Corporation. All rights reserved.