Money in Motion

How 2020 Asset Flows Can Influence 2021 Distribution Strategies

page title

Money in Motion

How 2020 Asset Flows Can Influence 2021 Distribution Strategies

April 2021

By Scott Anderson, Director of Research, BNY Mellon Data and Analytics Solutions

While 2020 is a year most would like to forget, certain trends either emerged or accelerated across the national broker-dealer universe that will influence how product development and distribution teams plan and strategize for the years ahead. 

Most notably, fee-based advisory channels continued to pick up considerable market share from commission-based programs, adding momentum to a tectonic shift that has been progressing for years. Meanwhile, SMA sales in 2020 showed the fastest annual growth in the segment in the last five years, helped along by a broad-based rotation into active strategies. 


To be sure, 2020 was a year unlike any other. It would be overkill to recite and relive what made the 12 months so extraordinary, as the pandemic, a fleeting recession, a dramatic rebound and an administration change each influenced capital flows to a certain degree.


Still, the trends that emerged, rather than reflecting the more idiosyncratic impact of the pandemic, mark longer-term secular shifts that should only become more acute as global markets stabilize. Distribution teams that have a view into this “money in motion,” and can gain an early read into the preferred channels and products of retail investors, will gain a distinct advantage as capital flows either accelerate or diverge in the year ahead.


If there’s a silver lining to the disruption last year, it’s that distribution teams now have a case study around how retail investors may react to black swan events, as well as a better understanding of the investment vehicles and advisory platforms either best positioned to withstand the volatility, or conversely, most likely to contribute to it. For instance, mutual funds experienced $43 billion in outflows in the first quarter, but ultimately saw $2 billion in net sales growth on the year. Meanwhile, the rotation into fixed income may have been predictable, but by drilling into the different contributors to the asset flows, other underlying trends emerged that will shape the “money in motion” for the foreseeable future.


I. A Fee-Based Renaissance as Commission-based Programs Fade 


If there was one constant last year, the loss of market share among commission-based programs represented a recurring theme. To better contextualize the falloff and recovery in mutual fund assets in 2020, it can help to isolate which advisory platforms were responsible for the biggest outflows and which experienced the most sales amid the recovery. Commission-based programs, for instance, were responsible for the largest mutual fund outflows in Q1, followed by Rep-as-PM programs, with outflows of $27 billion and $16 billion, respectively (See Figure 1). The difference, however, was that commission-based programs continued to lose market share for the balance of the year, while Rep-as-PM programs actually set the pace of the recovery. 

Net Flows (in US Billion Dollars) by Program Type - 2020

Source: BNY Mellon Data and Analytics Solutions

Firm discretionary programs, on the other hand, stood out as being the most consistent, seeing steady growth across both the mutual funds and exchange-traded funds (ETF) product sets, even in the teeth of the Q1 disruption. Over the course of the year, firm discretionary programs experienced the strongest total sales in the mutual fund category and finished in a virtual tie with Rep-as-PM programs in the ETF category, with $32 billion of total inflows, split evenly between mutual funds and ETFs.


Based on this performance, it’s possible to extrapolate a continued shift from commission- to fee-based programs. And among the latter, this isn’t the first time Rep-as-PM programs have proven to be temperamental amid market dislocations. They demonstrated similar volatility in 2018, the last time the S&P 500 finished the year in negative territory. Firm discretionary programs, alternatively, are reflecting the relative stability of assets that reside in home office models and unified managed accounts (UMAs), so can be expected to persevere even during periods of short-term uncertainty.


II. The Steady, Unrelenting SMA Expansion


Amid the shift from commission- to fee-based programs, separately managed accounts (SMAs) have emerged as a magnet for assets, attracting $16 billion of inflows across equities last year, and another $12 billion across fixed income. In fact, since the first quarter, SMAs registered a 37% increase in total assets.


The story, though, is in the balance of the SMA growth across asset classes, representing a sharp contrast with trends in the broader fee-based universe, where total fixed income inflows outpaced equity inflows $73 billion to $22 billion. Looking at the total proportion of net flows among the national broker dealers, U.S. equity SMAs made up 11% of all net sales, slightly below the total ETF inflows in the segment, but well above mutual fund inflows in the category, which were barely positive (see Figure 2). Perhaps more telling is the SMA growth among international and global strategies, where mutual funds and ETFs experienced outflows over the course of the year. Most of the growth was within global strategies, but international equity had previously been seeing outflows for the previous two years, so the shift may be notable as it relates to retail appetites.

Source: BNY Mellon Data and Analytics Solutions

The clout of SMAs last year was just as evident among the fastest-growing styles. While fixed income-oriented mutual funds (specifically intermediate core-plus and short-term bonds) captured the top two spots in 2020, SMAs occupied three out of the next four fastest-growing Morningstar styles (muni fixed income, large-cap growth, and global equity SMAs, respectively). Again, the prominence of SMAs particularly stood out within equities, as two of the top three fastest-growing styles were large-cap growth and global equity SMAs.


Looking ahead, as distribution teams look to play into and capitalize on momentum in active or passive flows, SMAs should no longer be considered the “forgotten active vehicle.” Among equities, they were a likely beneficiary of the rotation into active products that occurred last year.


III. Stock Picker’s Paradise: Active Strategies Re-emerge, Active ETFs Arrive


In a year marked by so much volatility and geopolitical change, it’s not surprising that active strategies were in focus. Within bonds, taxable fixed income accounted for over three-quarters of active ETF assets, the majority of which fell into the ultra-short bond category. It’s also worth noting that nearly half of all active ETFs reside on Rep-as-PM programs.


Keen observers, though, probably noticed that besides a bias toward fixed income last year, mutual funds and SMAs also dominated the top 10 styles based on net sales, while index funds occupied just three of the top ten spots. Outside of fixed income, in looking at mutual funds specifically, there was a gravitation to the foreign large-cap growth, small-cap growth and mid-cap growth segments, where smart beta products also captured an overwhelming share of ETF assets.


Looking more broadly at all fee-based programs, large-cap value and large-cap growth have experienced the most adoption for smart beta ETFs, which account for 26% and 18% of each style respectively, while large-cap blend has experienced the fastest sales growth within the smart-beta category more recently (see Figure 3). Generally, among the national broker dealers, active ETF adoption still largely revolves around taxable fixed income. However, across the Pershing platform – which can be viewed as a proxy for the independent channel – there has been an accelerated pickup of U.S. equity active ETFs, which account for nearly a third of the active ETF assets.

Source: BNY Mellon Data and Analytics Solutions

Looking ahead, it’s clear that that demand is percolating for active products across a range of vehicles and wrappers, particularly in niches that may offer a greater alpha opportunity to investors, such as small-cap or global strategies. Among active ETFs, anecdotally, track record and cost represent two significant factors that can either facilitate or stand in the way of adoption depending on the channel.


Conclusion


Given the volatility last year, it can be challenging to discern the signals from the noise. What the data is showing, however, is that the “money in motion” is translating into a more tailored approach in which retail investors and their intermediaries are looking to leverage both active and passive strategies through multiple wrappers.


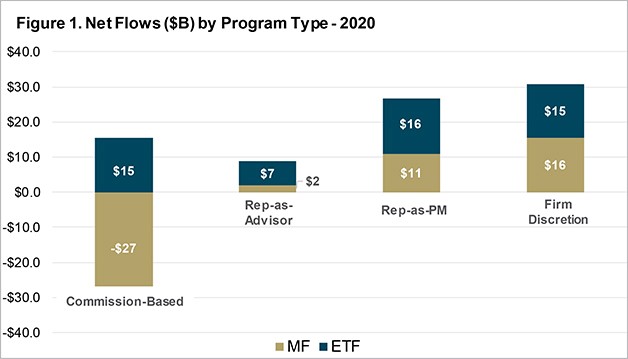
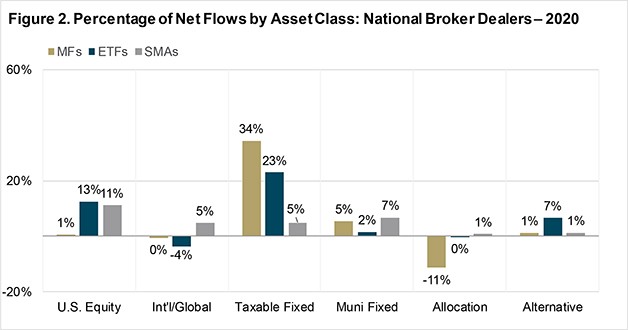
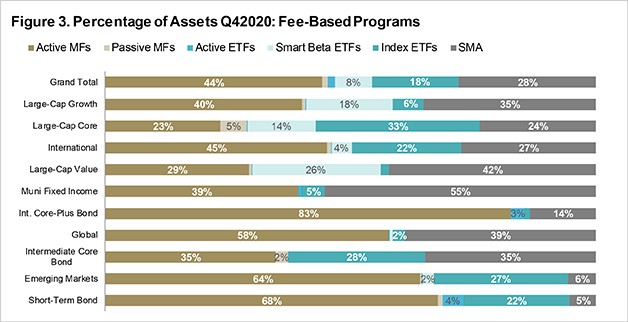
Among the more pertinent takeaways for distribution professionals from 2020, based on the data, was the relative stability and steady growth of firm discretionary programs, which stood in contrast to Rep-as-PM models that helped contribute to the volatility but also proved to be a strong growth engine as markets rebounded. Similarly, SMAs also proved to be a model of stability and growth, with balance across asset classes, while a broad rotation into active strategies helped to lift active ETF and smart beta strategies, in some cases, even in asset classes that have historically leaned passive, such as large-cap core strategies. One area distribution teams will want to continue to monitor is the momentum building in dedicated ESG strategies, across both mutual funds and ETFs. While market share for both product types remains under 2%, awareness and interest among retail investors continues to grow, particularly as these strategies prove out their investment theses over time.


The discussed insights represent just a taste of what’s available through BNY Mellon Data and Analytics Solutions to help inform distribution and marketing strategies and enhance how firms discern and pursue developing opportunities when engaging with financial advisors.

Are you an explainable AI company that we should know about?


Learn More [link to accelerator program page]

Interested in learning more about emerging technologies for the financial services industry? 


Sign-up for The Quarterly Update

BNY Mellon is the corporate brand of The Bank of New York Mellon Corporation and may be used to reference the corporation as a whole and/or its various subsidiaries generally.  This material does not constitute a recommendation by BNY Mellon of any kind.  The information herein is not intended to provide tax, legal, investment, accounting, financial or other professional advice on any matter, and should not be used or relied upon as such.  The views expressed within this material are those of the contributors and not necessarily those of BNY Mellon.  BNY Mellon has not independently verified the information contained in this material and makes no representation as to the accuracy, completeness, timeliness, merchantability or fitness for a specific purpose of the information provided in this material.  BNY Mellon assumes no direct or consequential liability for any errors in or reliance upon this material.


BNY Mellon will not be responsible for updating any information contained within this material and opinions and information contained herein are subject to change without notice.


BNY Mellon assumes no direct or consequential liability for any errors in or reliance upon this material. This material may not be reproduced or disseminated in any form without the prior written permission of BNY Mellon. Trademarks, logos and other intellectual property marks belong to their respective owners.


© 2021 The Bank of New York Mellon Corporation.  All rights reserved.

Business concept - high speed abstract MRT track of motion light for background in tokyo, japan