


Q2 Rebound in Active and Passive Asset Flows: Three Key Themes

Q2 Rebound in Active and Passive Asset Flows: Three Key Themes
November 2020
By Scott Anderson, Director of Research, BNY Mellon Data and Analytics Solutions
As the markets normalize, fund flows between active and passive products are being influenced by the crosscurrents of ongoing volatility, a continued rotation into fixed income, and the ascension of Rep-as-PM programs.
During the first six months of the year, mutual funds experienced a tale of two halves, with a massive surge of outflows in the first quarter followed by a moderate recovery in Q2. Packaged product flows related to exchange-traded funds (ETFs) and separately managed accounts (SMAs), however, maintained a far steadier trajectory, each attracting positive inflows of new assets in both Q1 and Q2, even as the market whipsawed from a significant disruption in March to a historic rebound that saw the S&P 500 quickly eclipse its previous record high by mid-August.
In the first quarter, the data from BNY Mellon Intermediary Analytics underscored the crucial role of ETFs as a stabilizing force in an otherwise chaotic market. The most recent analysis reinforces this trend, as ETFs and SMAs showed consistent growth, while mutual funds rebounded slightly. The Q2 data also surfaced growing appetites for fixed income and emphasized the role of Rep-as-PM programs as the most influential driver of fund flows across the mutual fund and ETF product universe.
As part of a recent webinar, we examined these trends in more detail, with some surprising findings that can help shape both near- and long-term distribution strategies.
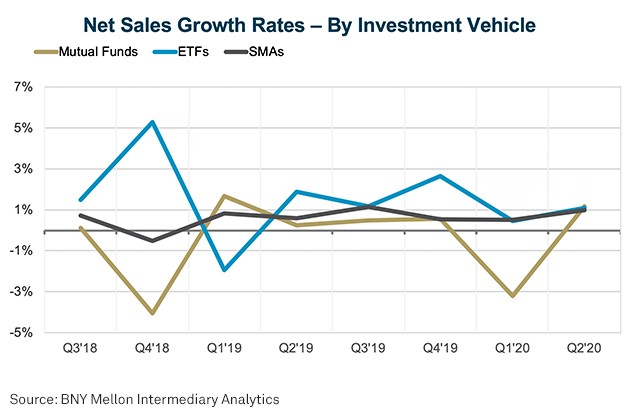
1. Mutual Fund Volatility Continues; ETFs and SMAs Show Consistent Growth
To put the volatility of the mutual fund space in perspective, the first quarter of the year saw a total of $41 billion in net outflows, which was only partially offset by $12 billion in net inflows in Q2 as the market rebounded. ETFs and SMAs, on the other hand, showed inflows of approximately $3 billion each in Q1 and at least doubled that amount during the subsequent quarter, adding $8 billion and $6 billion, respectively, in Q2.
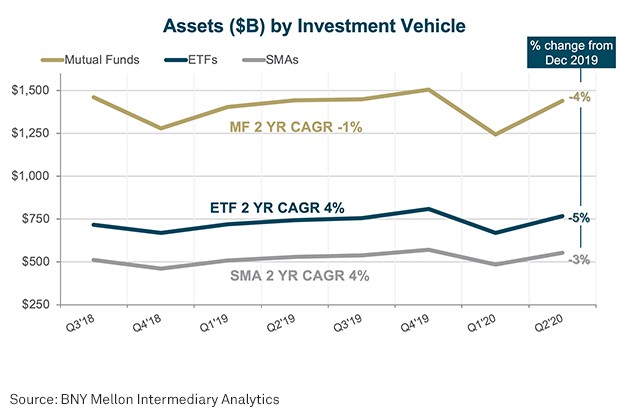
The data shows an acceleration of longer-term trends in which ETFs and SMAs continue to gain a larger proportion of the total asset pie. Over the last 24 months, looking at data from the national broker-dealers, ETFs and SMAs have each shown a two-year compound annual growth rate of 4%, versus a 1% decline in the CAGR of mutual fund assets over the same period. Mutual funds, though, still hold a considerable advantage in terms of total assets, with approximately $1.4 trillion.
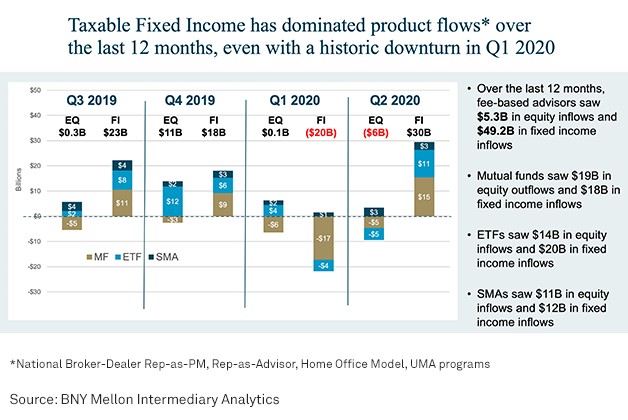
2. Fixed Income Drives Sales Over Last 12 Months; U.S. Equity Experiences Rare Q2 Traction Across Both Mutual Funds and SMAs
To put it simply, fixed income has dominated product flows over the last 12 months, a period that saw fee-based advisors generate $49.2 billion in fixed income inflows, compared with $5.3 billion in equity inflows.
Looking across the network of national broker-dealers, the shifting markets translated into more idiosyncratic asset flows within certain categories. For only the second time in three years, for instance, U.S. equity mutual funds and SMAs generated higher net sales than ETFs for the quarter. Both instances followed market disruptions.
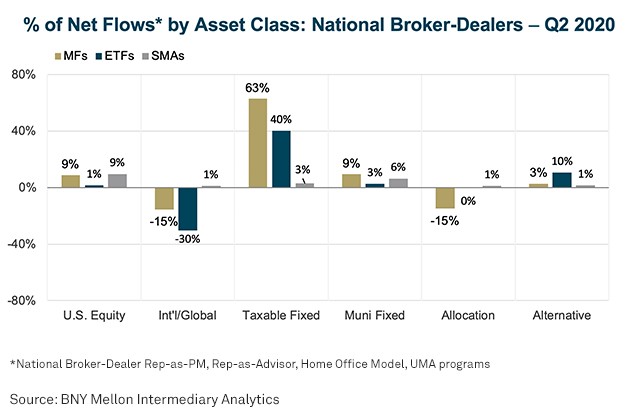
Taxable fixed income, meanwhile, continues to dominate product flows across the larger national broker-dealer universe. The ongoing interest in taxable fixed income, however, has come at the expense of international and global equity strategies as mutual funds saw net flows. In unpacking the data even further, the rotation away from international equity ETFs was fueled by outflows in emerging market dividend funds and foreign large-cap blended index strategies. It’s worth noting that for these data sets, we removed asset flows from commission-based programs.
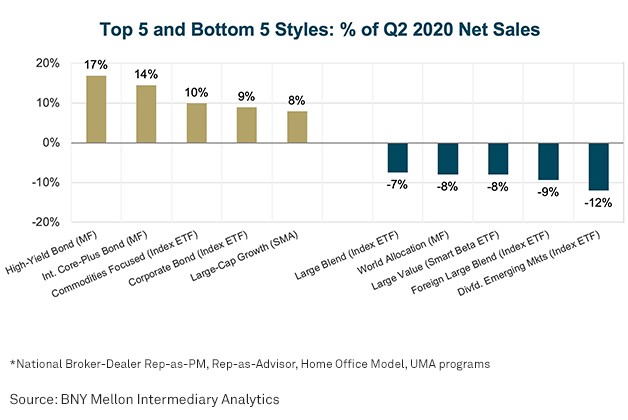
In looking at the top- and bottom-five styles based on Q2 net sales growth, observers can see how the low interest rate environment and ongoing flight to safety are influencing investor appetites. High-yield bond mutual funds, intermediate core-plus bond mutual funds and commodities-focused index funds ranked as the first, second and third fastest-growing categories.
Among the out-of-fashion styles, beyond the international and emerging markets strategies that saw significant outflows in the second quarter, large-cap blended ETFs rounded out the bottom three suffering significant declines in net sales.
3. Rep-as-PM Programs, While Volatile, Drive ETF and Total Growth
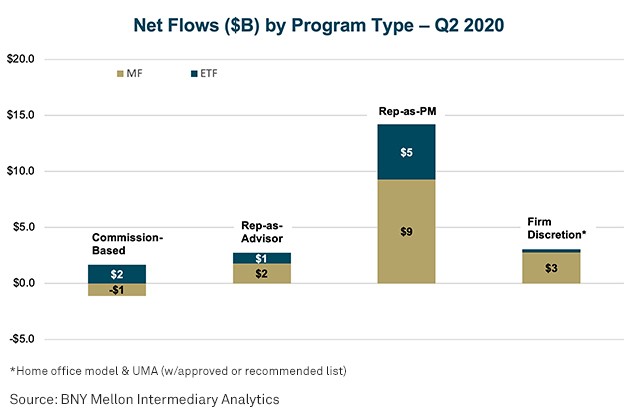
Another trend becoming more evident amid the volatility is the influence of Rep-as-PM (RPM) programs, which have fueled the bulk of asset flows across mutual fund and ETF products. RPM programs experienced outflows of $18 billion in the first three months of the year and saw inflows of $14 billion in the second quarter, over 60% of which was attributable to mutual fund assets. For comparison, Rep-as-advisor and full discretionary programs each experienced roughly $3 billion in Q2 inflows, much of which leaned toward mutual fund assets thanks to the rebound after the first-quarter sell-off. Commission-based programs, alternatively, continued to shed mutual fund assets, while adding roughly $2 billion in ETF inflows.
Another takeaway evident in the Q2 data was that Rep-as-PM advisors continue to utilize ETFs, but growth has been leveling off. Across all asset classes, the split between the total assets of ETFs and mutual funds is currently 46% versus 54%, respectively, with the proportion of ETF assets having grown just 1% compared to the second quarter of 2018.
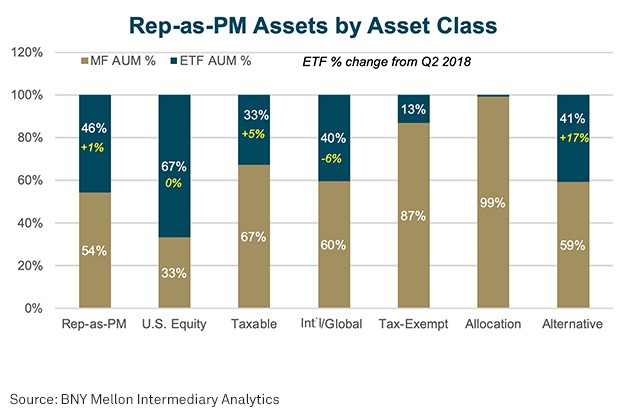
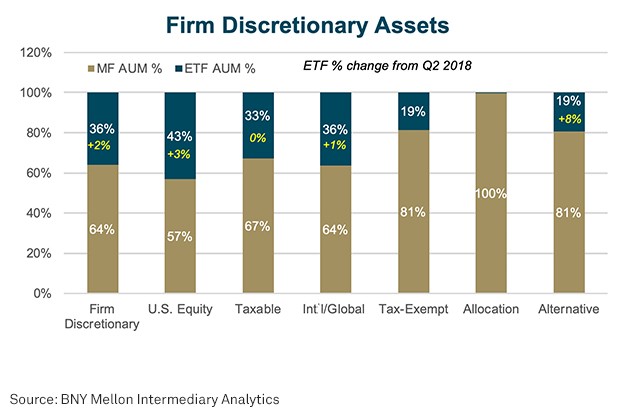
The difference is even more pronounced in looking at U.S. equities. Among the Rep-as-PM advisors, ETFs account for 67% of the total assets under management, although the segment has seen virtually no growth in the proportion of total assets. Discretionary advisors, alternatively, only have 43% of U.S. equity assets in ETFs, but have seen net sales in the category increase by 3% versus the 2018 second quarter.
The data brings to light some of the material differences that exist between advisor groups. Year-to-date, most of the net sales growth in the Rep-as-PM category stems from advances in taxable fixed income, across both mutual funds and ETFs. Within the mutual fund category, in particular, wild swings were evident as nearly $8 billion in Q1 outflows were later eclipsed by more than $9 billion in Q2 inflows, underscoring the more reactionary behaviors of the Rep-as-PM advisor group. Discretionary advisors, alternatively, rotated into U.S. equities in the first quarter and then largely held steady in Q2, which accounted for the bulk of the year-to-date net sales growth.
Regardless of how the economy recovers and where the markets end the year, 2020 will be characterized by the disruption caused by the global pandemic. Whenever a “return to normal” finally takes hold, the data will reveal the nuances of how this new normal differs from the pre-COVID environment market participants may remember. The discussed insights represent just a taste of what’s available through BNY Mellon’s Intermediary Analytics to help inform distribution and marketing strategies and enhance how firms discern and pursue developing opportunities when engaging with financial advisors.
To learn more, or view a replay of the discussed webinar, please click here.
BNY Mellon is the corporate brand of The Bank of New York Mellon Corporation and may be used to reference the corporation as a whole and/or its various subsidiaries generally. This material does not constitute a recommendation by BNY Mellon of any kind. The information herein is not intended to provide tax, legal, investment, accounting, financial or other professional advice on any matter, and should not be used or relied upon as such. The views expressed within this material are those of the contributors and not necessarily those of BNY Mellon. BNY Mellon has not independently verified the information contained in this material and makes no representation as to the accuracy, completeness, timeliness, merchantability or fitness for a specific purpose of the information provided in this material. BNY Mellon assumes no direct or consequential liability for any errors in or reliance upon this material.
BNY Mellon will not be responsible for updating any information contained within this material and opinions and information contained herein are subject to change without notice.
BNY Mellon assumes no direct or consequential liability for any errors in or reliance upon this material. This material may not be reproduced or disseminated in any form without the prior written permission of BNY Mellon. Trademarks, logos and other intellectual property marks belong to their respective owners.
© 2020 The Bank of New York Mellon Corporation. All rights reserved.