


Q3 2020 Recovery Continues
Intermediary Analytics Webinar Recap

Q3 2020 Recovery Continues
February 2021
By Scott Anderson, Director of Research, BNY Mellon Data and Analytics Solutions
What are the trends that should shape distribution strategies in 2021? If asset-flow data in Q1 2020 underscored the crucial role of ETFs as a stabilizing force and Q2 2020 data emphasized the role of Rep-as-PM programs as the most influential driver of fund flows, Q3 2020 data provided telling insights into how advisors are using active and passive products to fine-tune specific exposures in certain asset classes against a more normalized market backdrop.
Historically, the active-versus-passive debate within asset management has been black and white. Over the last few years, however, it has become far more gray as active product sets continue to expand beyond traditional mutual funds to now include active ETFs, smart beta, as well as separately managed accounts. Based on asset-flow data from BNY Mellon Intermediary Analytics, investors themselves are increasingly becoming vehicle-agnostic in terms of how their advisors devise allocation strategies. This trend was further reinforced in 2020 as investors coped with an accelerated market cycle, marked by excessive volatility in the first quarter followed by a rapid recovery in the two subsequent quarters.
We examined these trends in more detail in December as part of BNY Mellon Intermediary Analytics’ Q4 2020 Retail Market Trends Quarterly Update, highlighting these and other findings that should shape distribution strategies in 2021. Among the biggest takeaways, outside of the role of rep-as-PM programs as a driver of volatility, were insights underscoring the steady growth of separately managed accounts (SMAs) across all asset classes and pronounced rotations into certain equity strategies and shifting appetites among advisors for specific mutual fund styles.
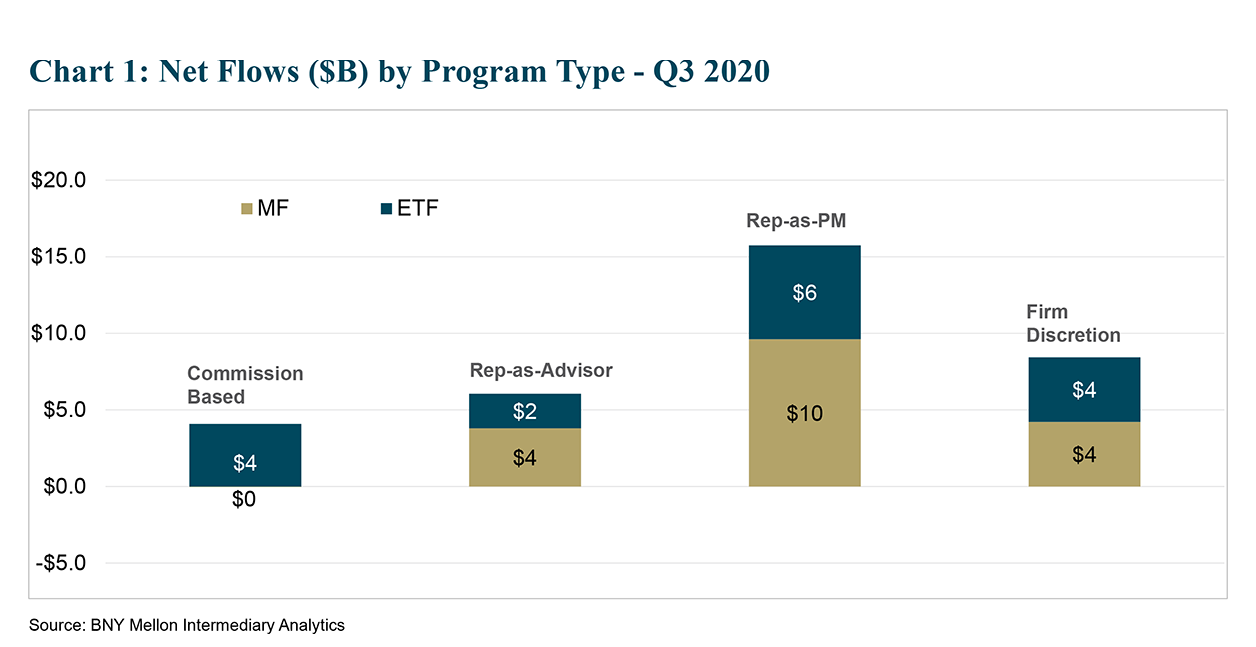
1. Rep-as-PM programs drive growth as well as volatility
In some ways, Q3 asset flows merely built on the momentum of Q2 trends. Taxable fixed Income, for instance, continues to dominate product flows across the larger national broker dealer universe. Perhaps even more notable, the influence of Rep-as-PM (RPM) programs as a driver of volatility continued to be evident in Q3.
While discretionary programs have actually produced the highest net flows year to date, RPM programs showed the most pronounced swing from the first quarter to both the second and third quarters across the mutual fund and ETF product sets. RPM programs experienced $16 billion in mutual fund outflows in Q1, eclipsed only by outflows in commission-based programs during that same period. Moreover, RPM programs were the only category to experience ETF outflows amid the Q1 volatility. Since then, however, RPM programs have seen the highest quarterly inflows in both mutual funds and ETF assets in the two subsequent periods (Chart 1).
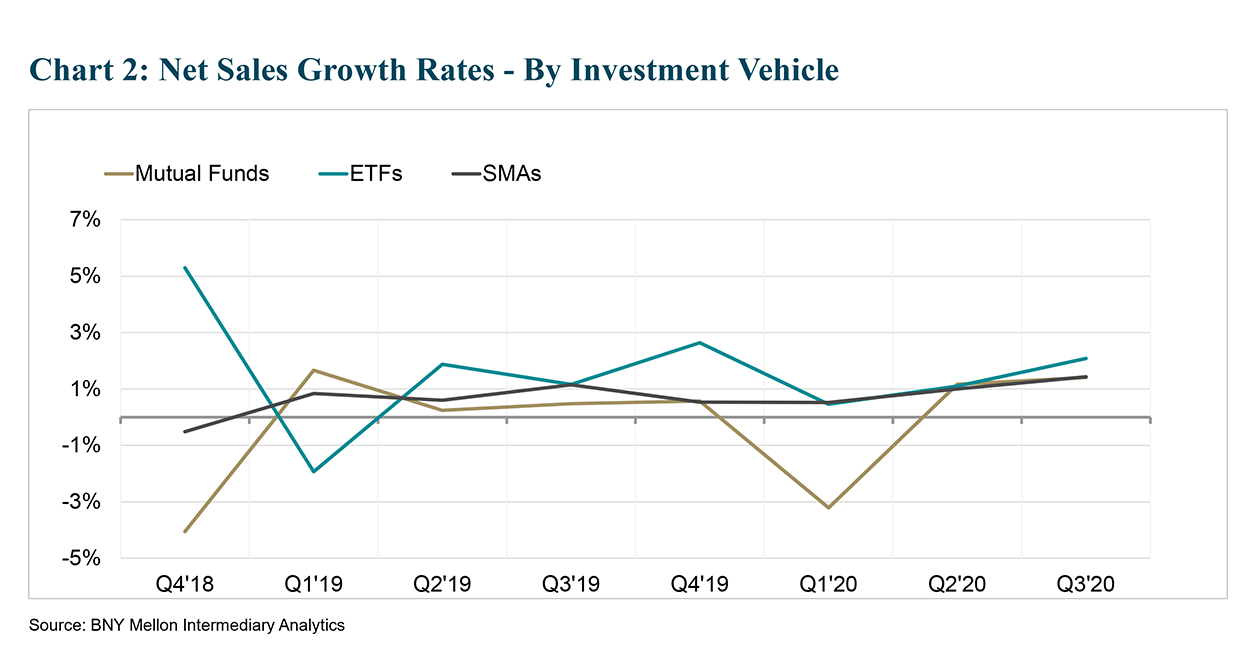
To better contextualize the outsized role of Rep-as-PM programs in the ensuing recovery, observers can recognize the acute drop-off and subsequent rebound in mutual fund sales growth over the past three quarters (Chart 2).
2. SMAs growing consistently across all asset classes
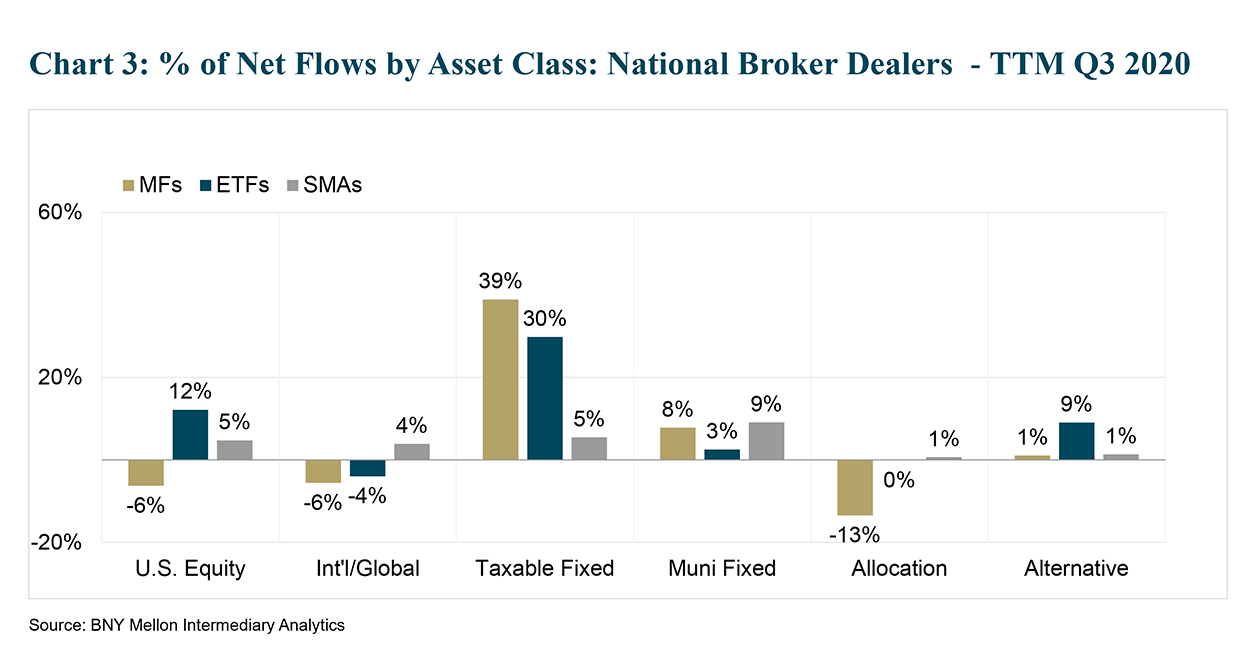
Although the volume of fund flows gravitating toward fixed-income products was the dominant trend in Q3, similar to previous quarters, shifts in sentiment elsewhere were just as significant. The consistent sales growth among SMAs, in particular, stood out across equity product sets. Over the first three quarters of the year, SMAs have experienced the most sales growth, year to date, than any comparable period since 2017. In terms of total AUM, which incorporates performance as well all new inflows, SMAs have registered a two-year CAGR of 6%, and in the third-quarter, SMA investment vehicles saw total assets jump by 9% year over year.
SMAs have attracted inflows across every asset category over the trailing-twelve-month (TTM) period. But in the third quarter, as U.S. Equity Mutual Funds and ETFs recorded significant outflows, SMAs registered a 5% increase in net inflows, which is also in line with the TTM sales growth. The consistency of SMAs is perhaps best reflected in the U.S. Equity category, juxtaposed against a fairly dramatic jump in inflows for ETFs and a significant decline in mutual fund flows over the trailing 12-month period (Chart 3).
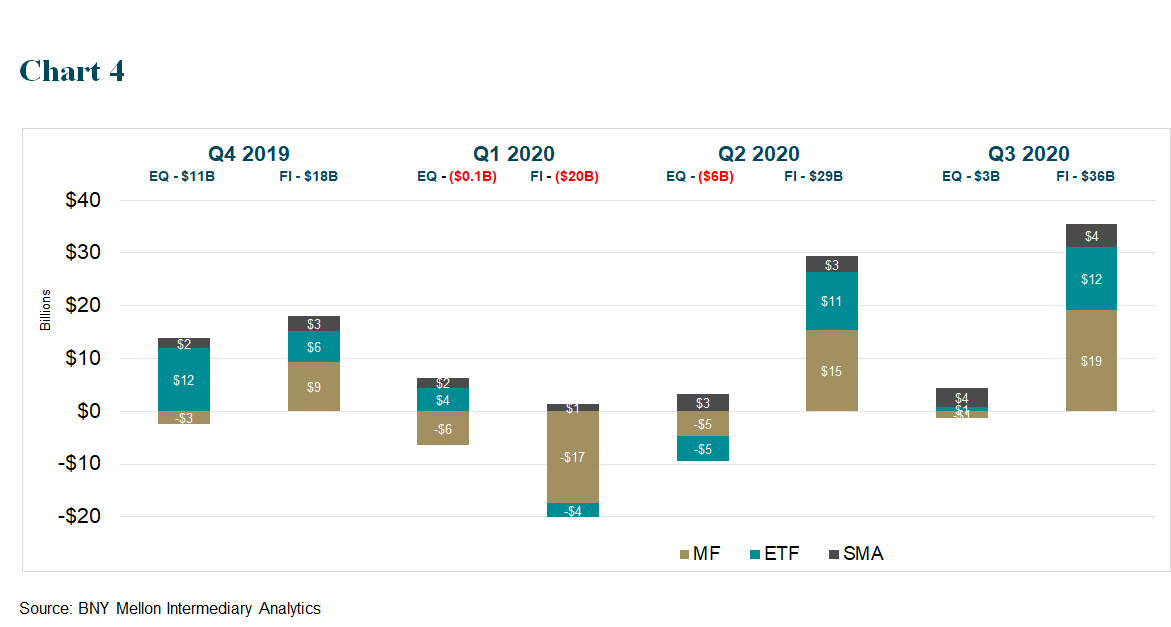
Similar to other categories, an ongoing and pronounced rotation into taxable-fixed income was also evident in SMAs, although at a far more measured pace than the mutual fund and ETF categories. Slicing this data another way shows the extent to which fixed income has dominated fee-based product flows over the past 12 months, but at the same time, underscores the consistency of SMAs, which saw a healthy balance between equity inflows of $11 billion and fixed income inflows of $12 billion (Chart 4).
3. Growth areas outside of fixed income
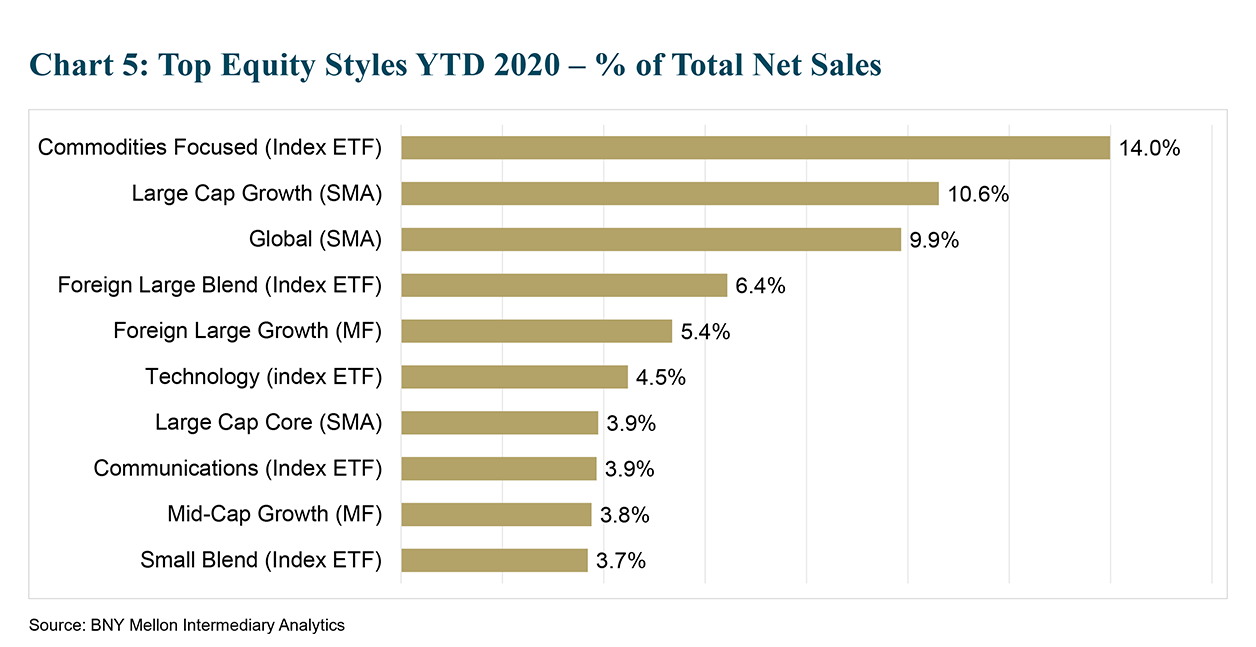
Beyond product-type preferences, other pronounced shifts were discernible across equities. In looking at the top styles, year to date, rotations into Sector ETFs helped to demonstrate how investors are “actively” utilizing passive products to amplify exposures in specific niches. To wit, Commodities-, Technology-, and Communications-focused ETFs and Index Funds were each among the top-10 styles based on total net sales in the first three quarters of 2020. These trends also help to show how sector ETFs are driving fee-based sales among advisors (Chart 5).
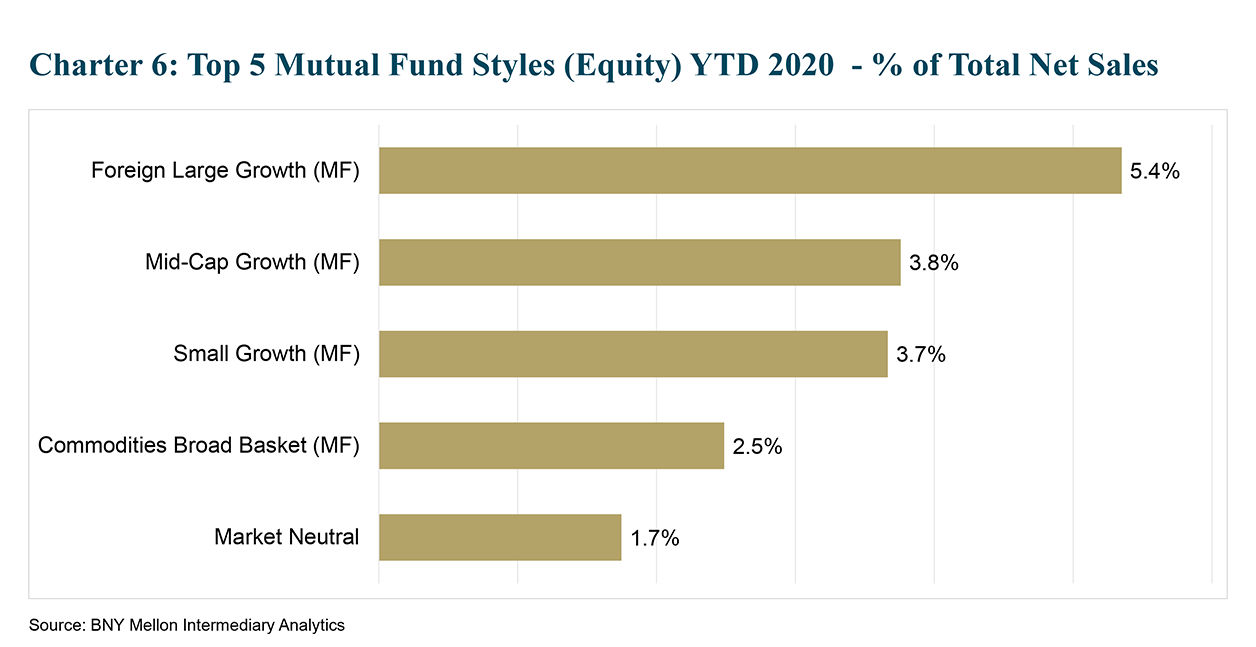
The areas within the mutual fund category that showed the most growth generally revolved around styles with limited ETF penetration. For instance, among the fastest-growing equity-oriented mutual funds, year to date, commodities are the only category in which ETFs exceed 30% as a percentage of the total assets. The rest of the top five – Foreign Large-Cap Growth, U.S. Mid-Cap Growth, U.S. Small-Cap Growth and Market Neutral funds – have ETF-penetration either at or below 20% of the total assets in the respective categories (Chart 6).
The impressive net sales growth across these categories also suggests that advisors are turning to active strategies in less efficient areas of the market where managers can demonstrate more success in beating their benchmarks. Alternatively, large-cap growth and large-cap blend mutual funds saw significant outflows in Q3.
Conclusion
To be sure, the market will continue to evolve, particularly as participants gain comfort around newer product categories, such as active ETFs and smart beta funds. Through exclusive insights available through BNY Mellon Intermediary Analytics, asset managers can fine-tune and enhance their distribution strategies to ensure their marketing efforts are resonating with their target audiences.
To learn more, or view a replay of the discussed webinar, please click here.
BNY Mellon is the corporate brand of The Bank of New York Mellon Corporation and may be used to reference the corporation as a whole and/or its various subsidiaries generally. This material does not constitute a recommendation by BNY Mellon of any kind. The information herein is not intended to provide tax, legal, investment, accounting, financial or other professional advice on any matter, and should not be used or relied upon as such. The views expressed within this material are those of the contributors and not necessarily those of BNY Mellon. BNY Mellon has not independently verified the information contained in this material and makes no representation as to the accuracy, completeness, timeliness, merchantability or fitness for a specific purpose of the information provided in this material. BNY Mellon assumes no direct or consequential liability for any errors in or reliance upon this material.
BNY Mellon will not be responsible for updating any information contained within this material and opinions and information contained herein are subject to change without notice.
BNY Mellon assumes no direct or consequential liability for any errors in or reliance upon this material. This material may not be reproduced or disseminated in any form without the prior written permission of BNY Mellon. Trademarks, logos and other intellectual property marks belong to their respective owners.
© 2021 The Bank of New York Mellon Corporation. All rights reserved.