


Vantage Point: Alphabet Soup
Vantage Point: Alphabet Soup
July 2020
Quarterly Outlook Q3.2020
By Shamik Dhar, Alicia Levine, Liz Young, Lale Akoner, Bryan Besecker, Sebastian Vismara
Introduction
WELCOME TO THE LATEST EDITION OF VANTAGE POINT
Since the last edition of Vantage Point, COVID-19 has wreaked both human and economic devastation on the world. At the time of writing (June 25), worldwide over 9 million people have contracted the disease and more than 450,000 have died from it. The response has been to lock down a number of economies in an attempt to reduce the transmission rate and reduce the so-called R number to below 1. The upshot has been the largest global economic contraction since economic records began: the world economy could have shrunk by around 10% in Q2, with huge knock-on effects onto employment and business profitability. The economic policy response has been impressive, as both central banks and governments have stepped in to prevent recession turning into depression. In this edition, we look back at what we’ve been through, look ahead to what might happen, assess the monetary and fiscal policy response, analyse the impact on markets and finally draw some broad investment conclusions in what is a highly uncertain and rapidly evolving situation.
There is good news and bad news about what we’ve been through. The good news is that we may be past the worst: the world economy probably troughed in late-April or early May. The bad news is that the worst was, economically speaking, very bad indeed. The epicenter of the disease moved from China in Q1 to Europe and the U.S. in Q2. Some European economies – Italy, Spain, the UK – may well contract by a quarter to a third in the second quarter. The U.S. economy is likely to have shrunk by upwards of 10% (quarterly change, not annualized), while unemployment has risen by over 30 million. Lockdown measures are beginning to ease now and we should see a pickup in activity shortly, but the extent and duration of the recovery remain hugely uncertain.
Looking ahead, we once again describe an alphabet soup of potential recovery scenarios from here. We describe a ‘V’, a ‘W/U’, an ‘L’, and an ‘I’ scenario. Crucially, we also define precisely what we mean by each scenario, differentiating them by the time it takes to recover the pre-crisis level of GDP. Given the scale of the decline to date, growth rates in the second half of the year are likely to be very high, even if economies are only in reality opening up slowly – so GDP levels are what matter here and we have recast our GDP fan charts into levels to make that point clear.
What kind of recovery we get depends fundamentally on the course of the disease from here. If a large number of economies can exit lockdown without seeing the frequency of cases spike beyond levels health systems can cope with, then a ‘V’-shaped recovery is on the cards, with global GDP returning to pre-crisis levels by the middle of 2021. However, if there is a large second wave, possibly in the Northern Hemisphere Fall/Autumn that necessitates a return to partial or full lockdown, then a ‘W/U’-shaped recovery becomes likely and we are unlikely to see pre-crisis levels of GDP restored until 2022. If, in either case, we see permanent demand and capacity destruction, a prolonged, slow or ‘L’-shaped recovery, becomes likely. That scenario could also trigger another bout of financial market instability, especially if a wave of bankruptcies and defaults causes parts of the credit market to collapse. Finally, our ‘I’ scenario refers to ‘inflation’; it is a variant of the ‘V’, in which a stronger than-expected recovery, coupled with some reduction in supply capacity, causes inflationary pressure to rise in 2021 and forces central banks to reconsider their ultra-easy stance much sooner than markets currently expect. As usual, we attach probabilities to these scenarios and present all our forecasts in the form of ‘fan charts’, which describe not just the most-likely and weighted average outcomes, but also the level of uncertainty and where the balance of risks lies. In times like these, investors need to take account of risk as well as return and our fan charts help them to do that. After much debate, we have settled on the following probabilities for our scenarios: the ‘V’ gets 50%; ‘W/U’ 30%; ‘L’ 15% and ‘I’ just 5%. In short, we are a little bit more optimistic about the chances of a ‘V’ than we were last time, but the balance of risks remains firmly shifted to the downside. Our downside scenario probabilities add up to 45%, so are slightly odds against, but the outcomes in those scenarios are so negative that a number of our fan charts display a large negative skew.
We conclude with some broad investment conclusions. One difficulty is that equity markets in particular have been rallying strongly since late March, on the back of decisive central bank intervention designed to stave off another financial crisis. They seem to be pricing in a relatively strong ‘V’-shaped recovery and, although realised volatility remains high, and measures of financial market stress such as Libor-OIS spreads remain higher than they were pre-crisis, markets do not seem to be pricing in as much downside risk as our fan charts would imply.
As a result, the investment advice is nuanced: cautious but gradually increasing allocation to risky assets (equity and credit), but at lower-than-normal levels of overall portfolio risk, coupled with hedges where possible. That’s a difficult message to get over, let alone for investors to implement, but it reflects the precariousness and uncertainty of the situation we find ourselves in. Let’s hope we emerge from it soon.

Shamik Dhar
Chief Economist
BNY Mellon Investment Management
Executive Summary
What We Think - Economic Scenarios
50% PROBABILITY
V-shaped recovery SCENARIO
We are past the trough in global economic activity and peak lockdowns. Economies continue to reopen. Health care systems are able to manage any new outbreaks. Consumers and businesses adapt helping to limit the transmission rate from spiking higher. A second round of lockdowns is prevented and GDP in most countries recovers to pre-crisis levels by the second half of 2021. Fiscal and monetary stimulus, pent up demand, and less supply side disruption support growth. Credit markets ease further and risk assets continue to gain as investors increasingly learn that the long-term growth consequences of the disease will be limited.
30% PROBABILITY
W/U-shaped recovery SCENARIO
Covid-19 virus cases resurface in the northern hemisphere Fall/Autumn leading to substantial and widespread outbreaks. Even if more localized, the virus spread is large enough to require a return to partial or full lockdowns despite better equipped health systems. Similar to the first wave, global economic activity falls sharply. Renewed weakness from already vulnerable economies and uncertainty trigger widespread risk-off sentiment, which lasts longer than seen during February and March. A second financial shakeout ensues as stocks decline towards the lows in March and Treasury yields approach 0%. Policymakers struggle to put a floor on rapidly deteriorating sentiment and stress in dollar funding markets picks up, particularly for countries not included in the Fed’s existing swap lines agreements. Markets bottom by mid-2021 and GDP does not recover to pre-crisis levels until the second half of 2022.
15% PROBABILITY
L-shaped recovery SCENARIO
Just like our W/U scenario, this scenario sees a sizeable second wave in major countries in Q3-Q4 2020 that necessitates partial or full lockdowns. Unlike our W/U scenario, there is a permanent hit to output in major economies (hence the L-shape recovery), as outbreaks trigger severing of global supply chains and accelerate existing deglobalization trends. The impact on both Europe and the US is huge with permanent demand and capacity destruction. The disruptions to supply chains lead to higher global costs and inflationary pressure. Central banks can accommodate to some degree, but not as much as under the V-shaped scenario. Risk markets sell off, global yields dive further into negative territory. In the longer term, the liberal international trading/ investment order is crippled and a new narrative takes hold: the virus has accelerated an underlying trend in which re-shoring and nationalism means higher costs and lower growth for years.
5% PROBABILITY
I is for Inflation SCENARIO
In terms of the path of the virus, this scenario is much like the V-shaped one. The difference here is that the US growth recovery is stronger than expected, capacity constraints begin to bite, and the pick-up in US inflation is more rapid, prompting the Fed to tighten in Q2 2021, much sooner than markets currently expect. US remains the most resilient economy and resumes its upward trajectory in Q3 2020. Tighter US policy depresses activity in the Eurozone and China. The dollar shortage reappears and capital flight from EMs picks up and the ‘carry trade’ reverses. China, Asia and other EMs hit hardest, but knock-on effects to developed economies too, notably Eurozone.
Capital Market Pricing - What the Markets Think
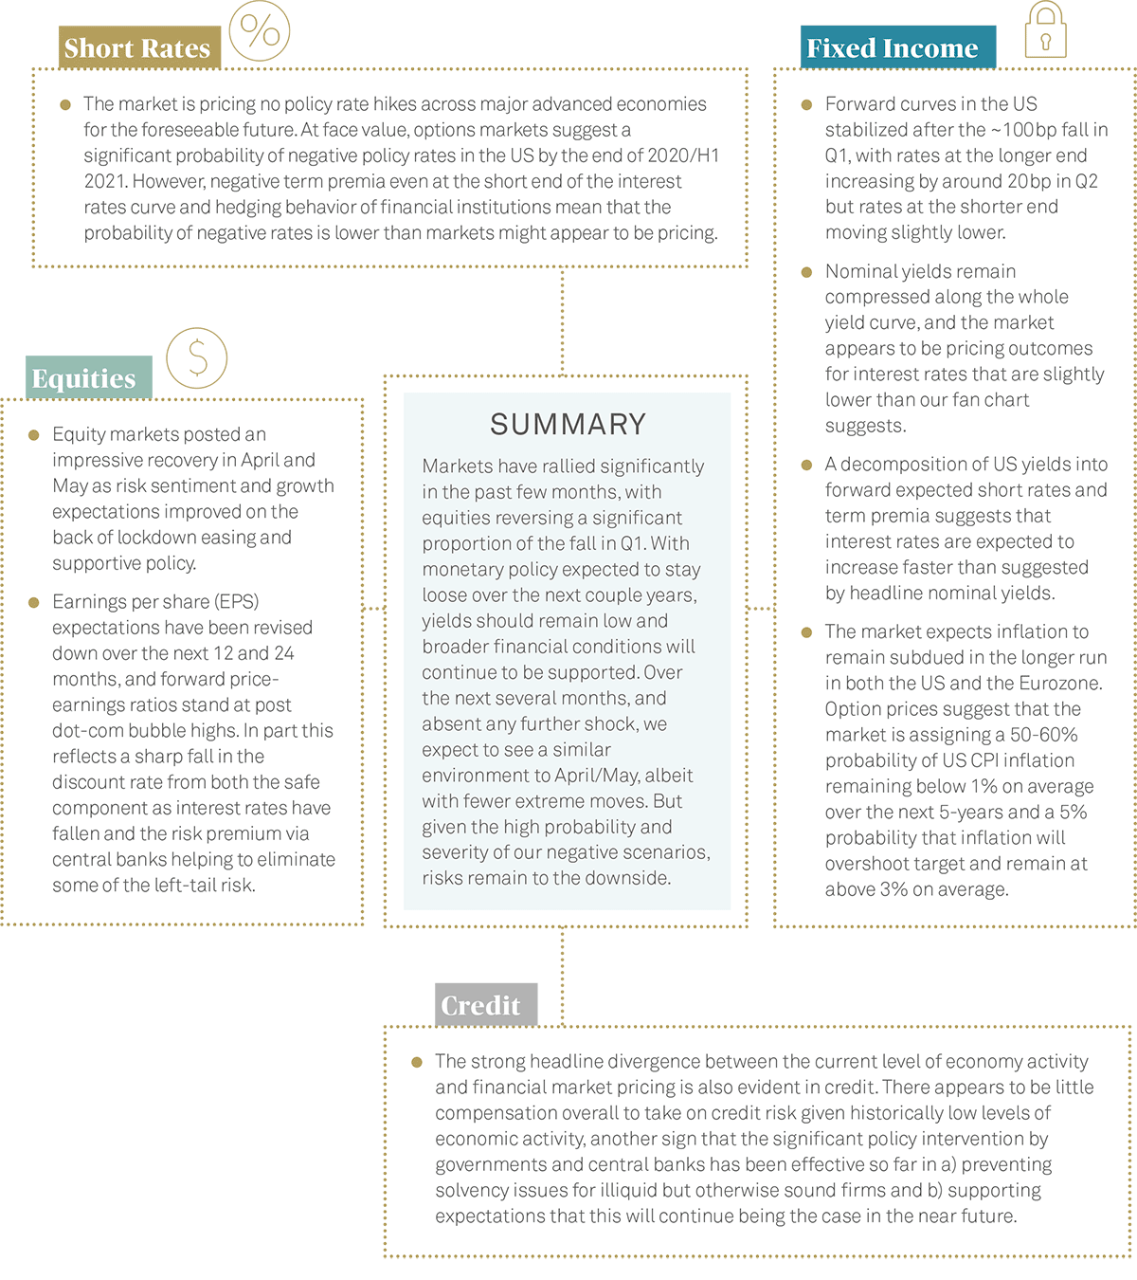
Investment Conclusions
Equities
Our equity fan charts generally show markets rising as a central expectation, but with large uncertainty and a big downside skew, thanks to the severity of the downside outcomes. Our overall attitude is therefore cautiously positive towards equities, but expect judicious stock selection to be key.
We acknowledge the opportunity offered by US equity markets and suggest a balanced approach to cyclical sectors (Industrials, Financials, Energy) and higher growth sectors (IT, Health Care) as we expect cash to re-enter equities as economies continue to reopen.
Given interest rates are likely to stay low for a long time, dividend-paying equities are an attractive income generator and less volatile component of equity allocations. Small businesses have been hit hardest by this crisis, but fiscal support and the expectation for a rapid restart have driven sentiment higher, improving the outlook for small-cap stocks.
Europe faces fiscal headwinds that increase downside risks, but there is room for European equities to catch-up through 2020 as global demand comes back online and the region is supported by the expectation for a large fiscal support package.
EM risks have moderated recently as several major countries have started to ease lockdowns. The USD has shown weakening bias, and oil prices have started to rise again. Still, the macro environment for many EMs remains challenging and downside risks are present. As the pace of economic recovery will be countryspecific, EM asset performance will remain idiosyncratic.
Fixed Income
Given the plethora of monetary policy and fiscal support, particularly in the US, we believe the risk of a spike in sovereign yields is limited and the US yield curve is likely to see a gradual steepening as the recovery ensues. This asset class remains an effective hedge against macro risks and despite historically low yields, still offers diversification value in the event of a downside shock.
Our new credit fan charts show the high-yield less investment grade spread most likely remaining in the 300-500bps range. There is a large upside skew, however this is somewhat smaller than the downside skew in equities. To an extent, that reflects a confidence that the Federal Reserve and other central banks can offset a credit crunch in all but the most challenging scenario (the ‘L’). Overall, this suggests cyclical credits can offer exposure to a recovery without presenting outsize left-tail risks.
U.S. Dollar
- In the short term, the dollar is likely to act as a barometer of global financial stability, rising when stresses increase, but falling back as confidence in the global financial system returns. The probabilityweighted average points to the dollar being broadly flat over our forecast horizon, but with higher-than-usual volatility and an upside skew. This outlook isn’t very different from market pricing, given small interest rate differentials across the major economies and subsiding stress indicators, such as the crosscurrency basis. Again, this outlook is underpinned by central banks’ willingness to supply dollars in the event of another lurch into crisis.
Alternatives
Multi-asset strategies that utilize put options for protecting against swift downdrafts in equities, and those with the flexibility to quickly rotate into cash if one of our downside scenarios becomes increasingly likely.
We believe the market is currently underpricing inflation risk and investors can protect purchasing power with real assets and precious metals.
Learn more in the full report
BNY Mellon Global Economics and Investment Analysis team


IMPORTANT INFORMATION
This material should not be considered as investment advice or a recommendation of any investment manager or account arrangement. Any statements and opinions expressed are those of the authors stated, as at the date of publication, are subject to change as economic and market conditions dictate, and do not necessarily represent the views of BNY Mellon or any of its affiliates. The information has been provided as a general market commentary only and does not constitute legal, tax, accounting, other professional counsel or investment advice, is not predictive of future performance and should not be construed as an offer to sell or a solicitation to buy any security or make an offer where otherwise unlawful.
The information has been provided without taking into account the investment objective, financial situation or needs of any particular person. Please consult a legal, tax or investment advisor in order to determine whether an investment product or service is appropriate for a particular situation. BNY Mellon and its affiliates are not responsible for any subsequent investment advice given based on the information supplied. This is not investment research or a research recommendation for regulatory purposes as it does not constitute substantive research or analysis. To the extent that these materials contain statements about future performance, such statements are forward looking and are subject to a number of risks and uncertainties. Information and opinions presented have been obtained or derived from sources which BNY Mellon believed to be reliable, but BNY Mellon makes no representation to its accuracy and completeness. BNY Mellon accepts no liability for loss arising from use of this material.
BNY Mellon Investment Management is one of the world’s leading investment management organizations and one of the top US wealth managers, encompassing BNY Mellon’s affiliated investment management firms, wealth management organization and global distribution companies. BNY Mellon is the corporate brand of The Bank of New York Mellon Corporation and may also be used as a generic term to reference the Corporation as a whole or its various subsidiaries generally.
No part of this material may be reproduced in any form, or referred to in any other publication, without express written permission. All information contained herein is proprietary and is protected under copyright law.
NOT FDIC INSURED | NO BANK GUARANTEE | MAY LOSE VALUE |
BNY Mellon Investment Adviser, Inc, and BNY Mellon Securities Corporation are subsidiaries of BNY Mellon. ©2020 BNY Mellon Securities Corporation, distributor, 240 Greenwich St., New York, NY 10286.